Report gallery
Power BI templates for construction.
Explore dashboard examples for Revit, IFC, Navisworks, and ACC. Compare ready-to-use templates with custom reports built from model data.
Find a dashboard for your next review
Open a public sample report without a Frame account. Each example explains its inputs and setup. Templates for your own models require a Frame account and the relevant plan; custom examples may need additional Power BI work.
Starter Template
Every element, every property, and the 3D model, connected in one Power BI report.
Explore the template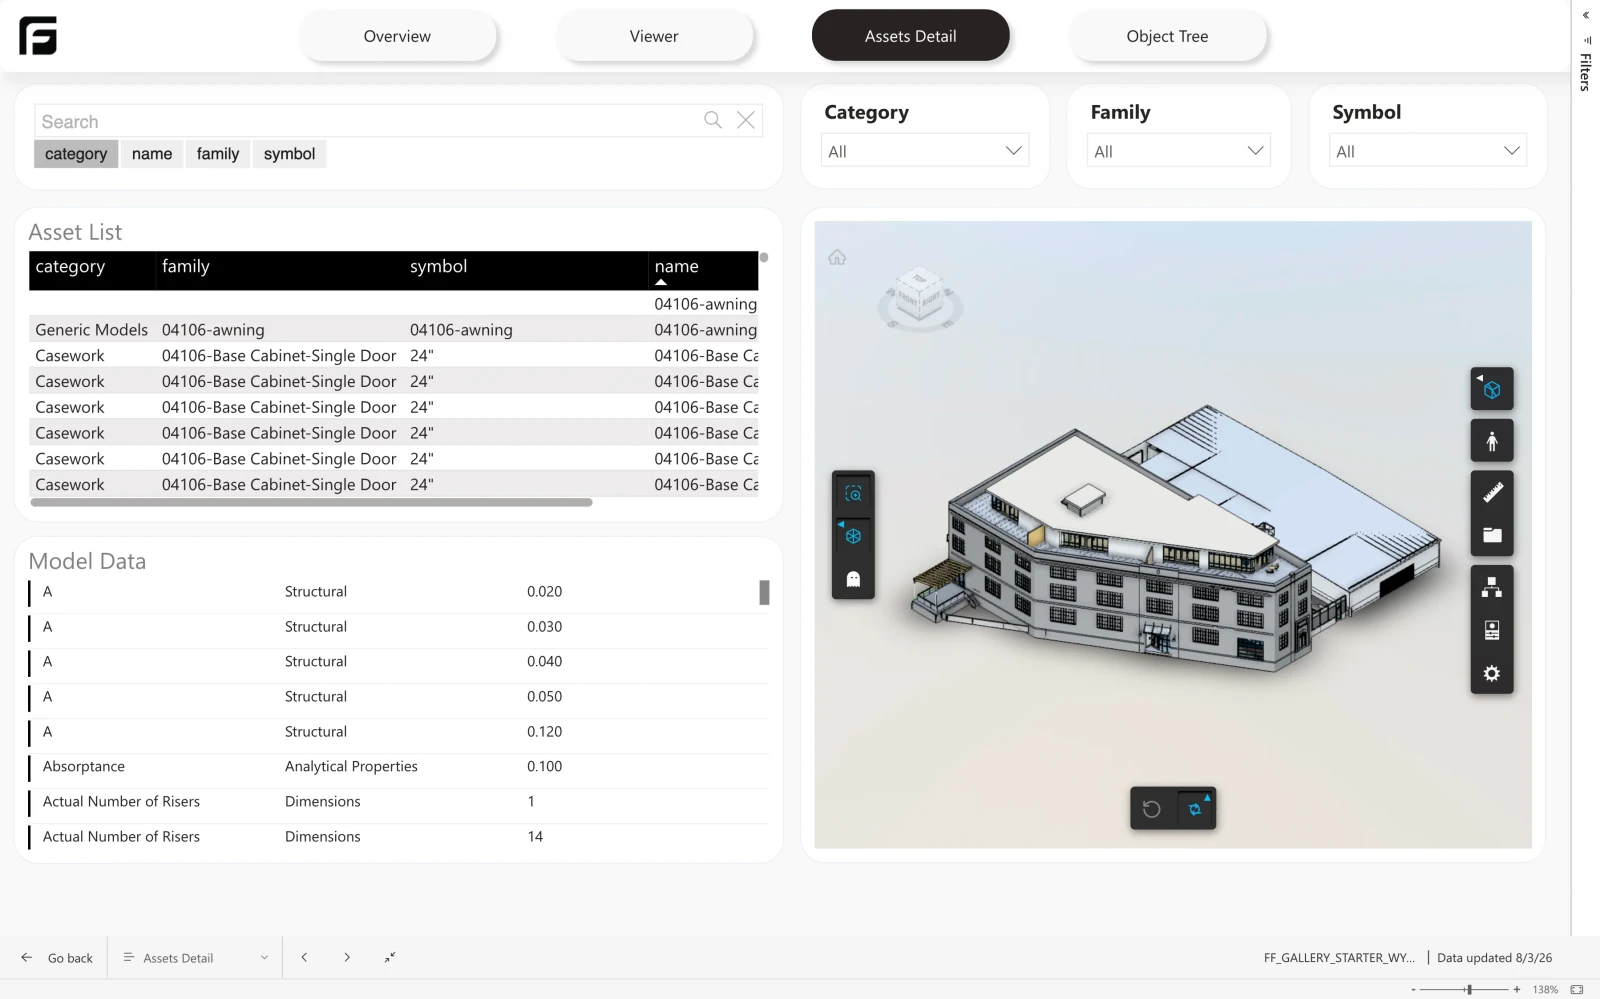
IFC Starter
Upload an .ifc file and get a Power BI report that still understands the model behind the numbers.
Explore the template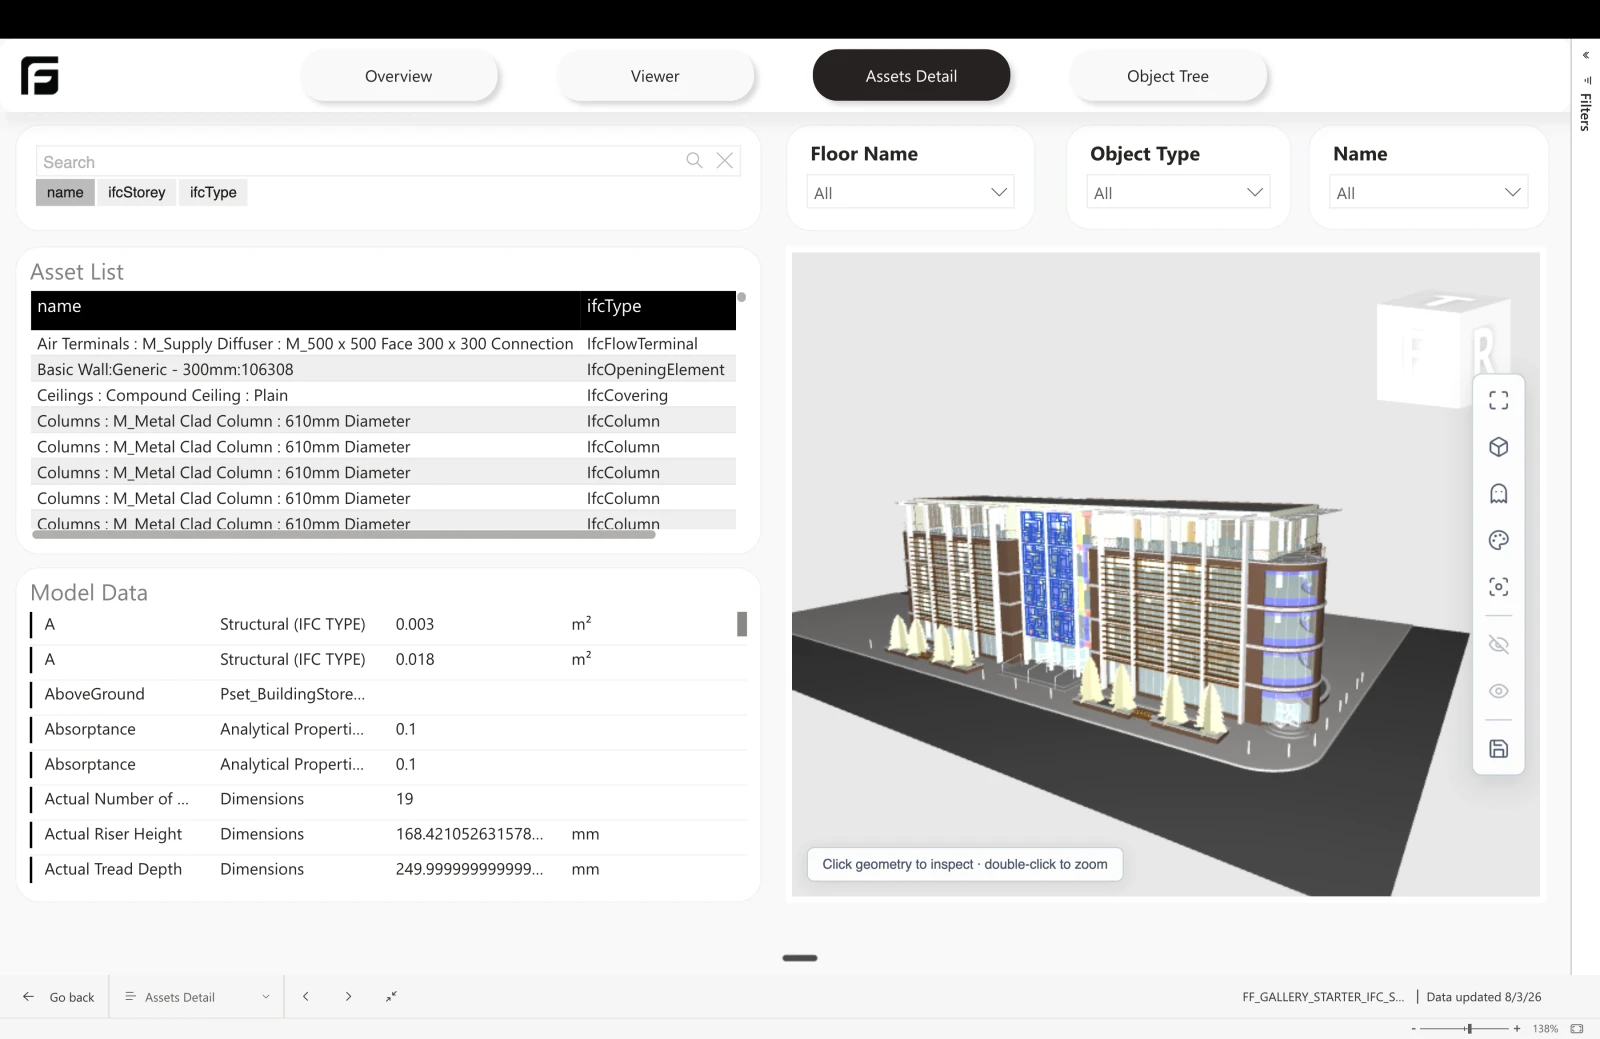
Clash Report
Turn Navisworks Clash Detective results into a coordination dashboard with status, assignment, and aging.
Explore the template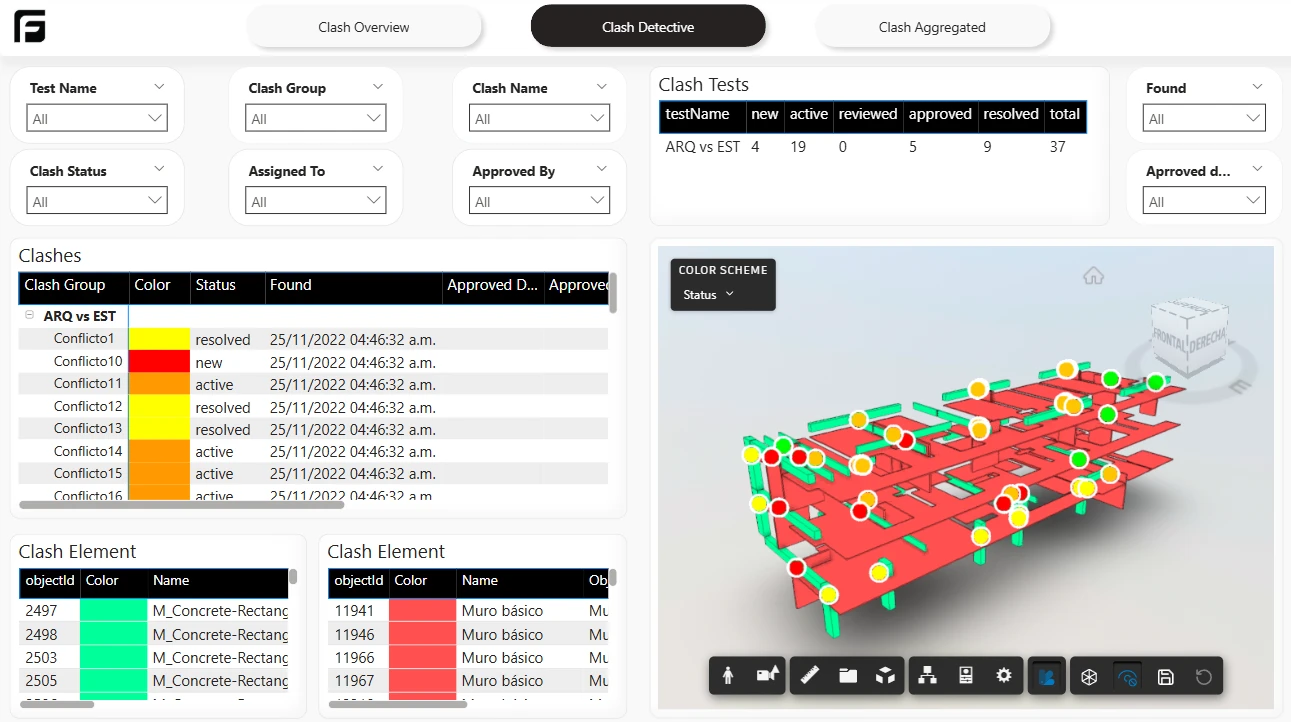
Frame Versions
Compare model slots in Frame and see what changed between them, element by element.
Explore the template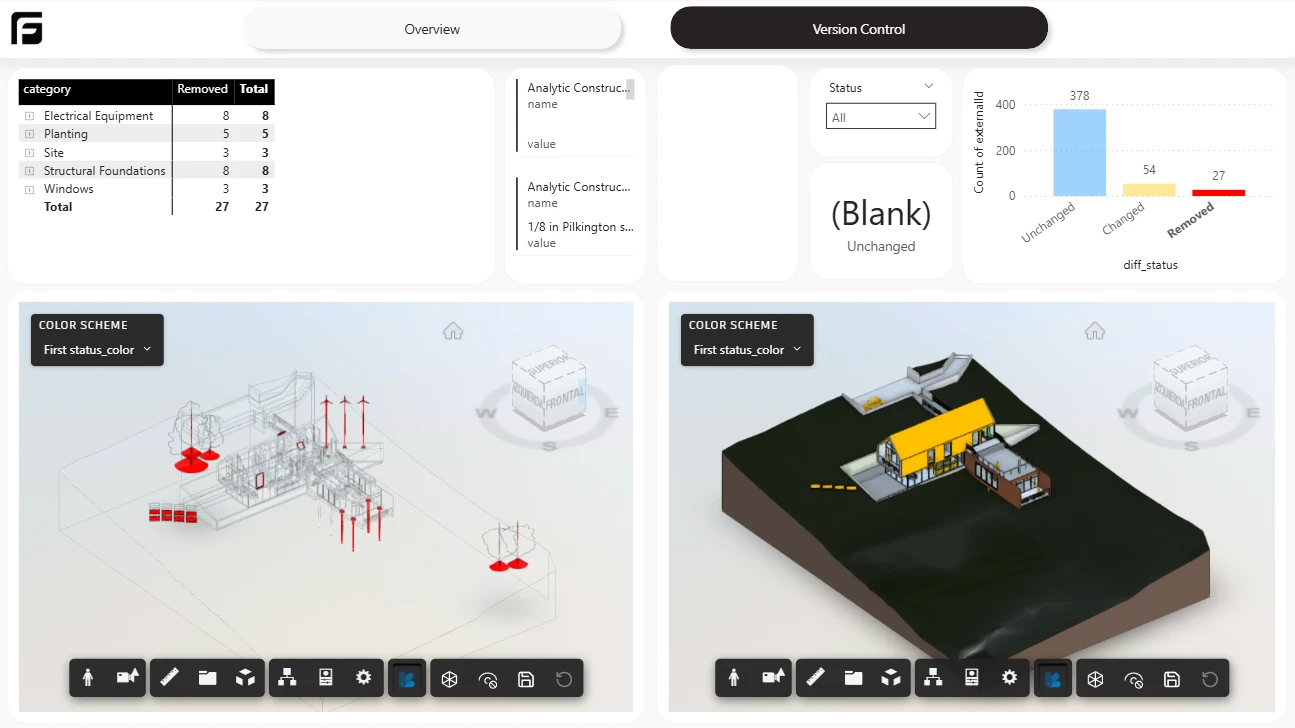
Model Health
Visualise Autodesk Model Checker results against your Revit model, with family size and performance breakdowns.
Explore the template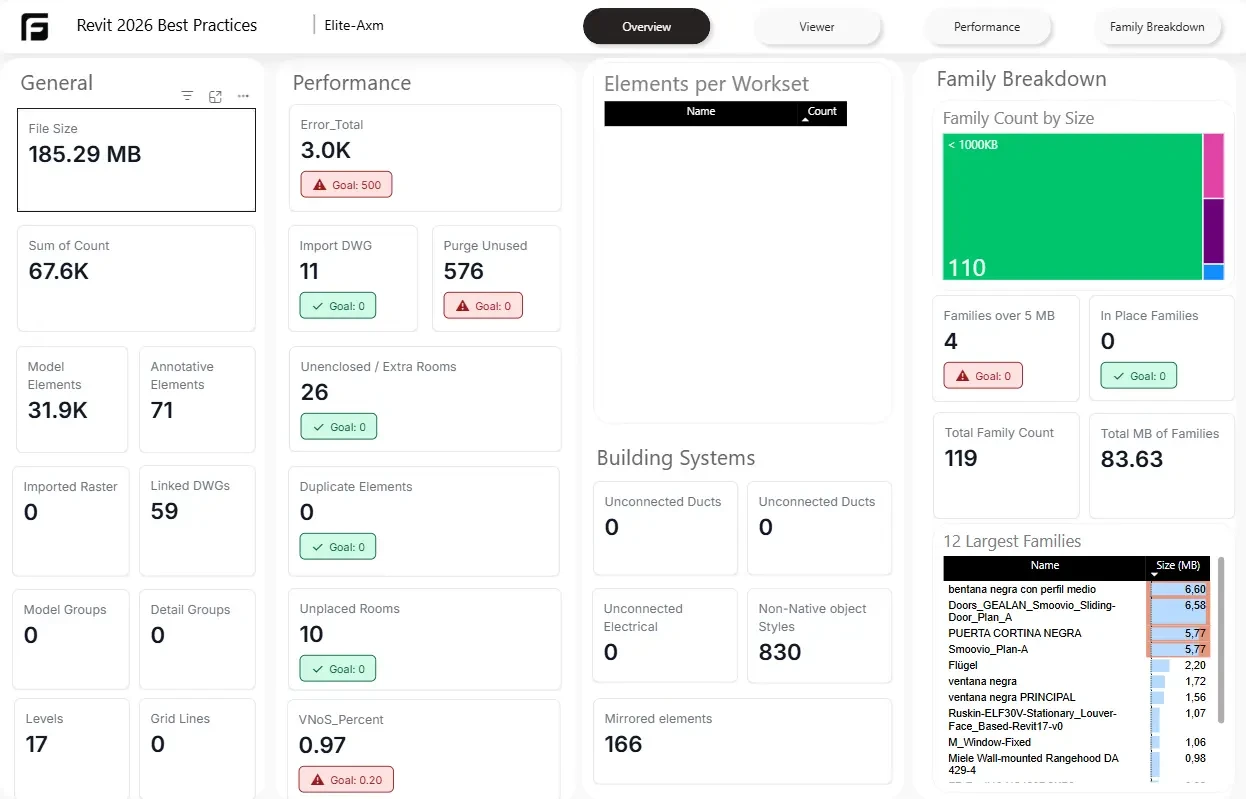
ACC Issues
Issue tracking from Autodesk Construction Cloud, with status, aging, root cause, and issues pinned to the model.
Explore the template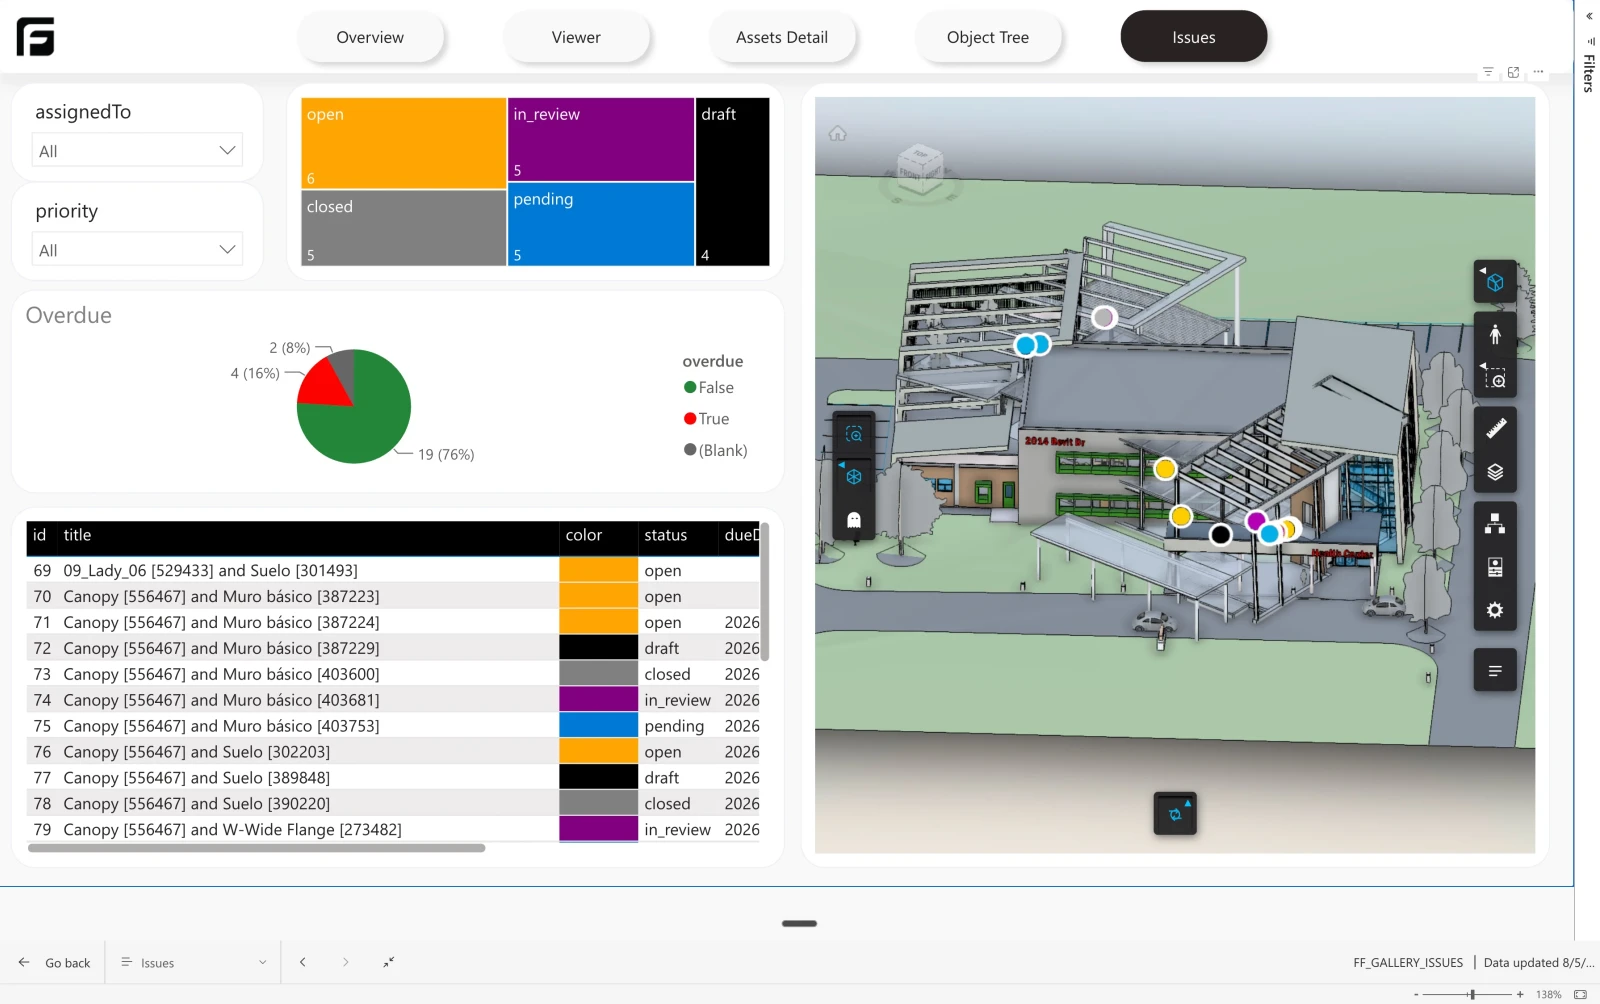
Version History
Walk every version of an ACC model and track how elements and properties changed across the whole lineage.
Explore the template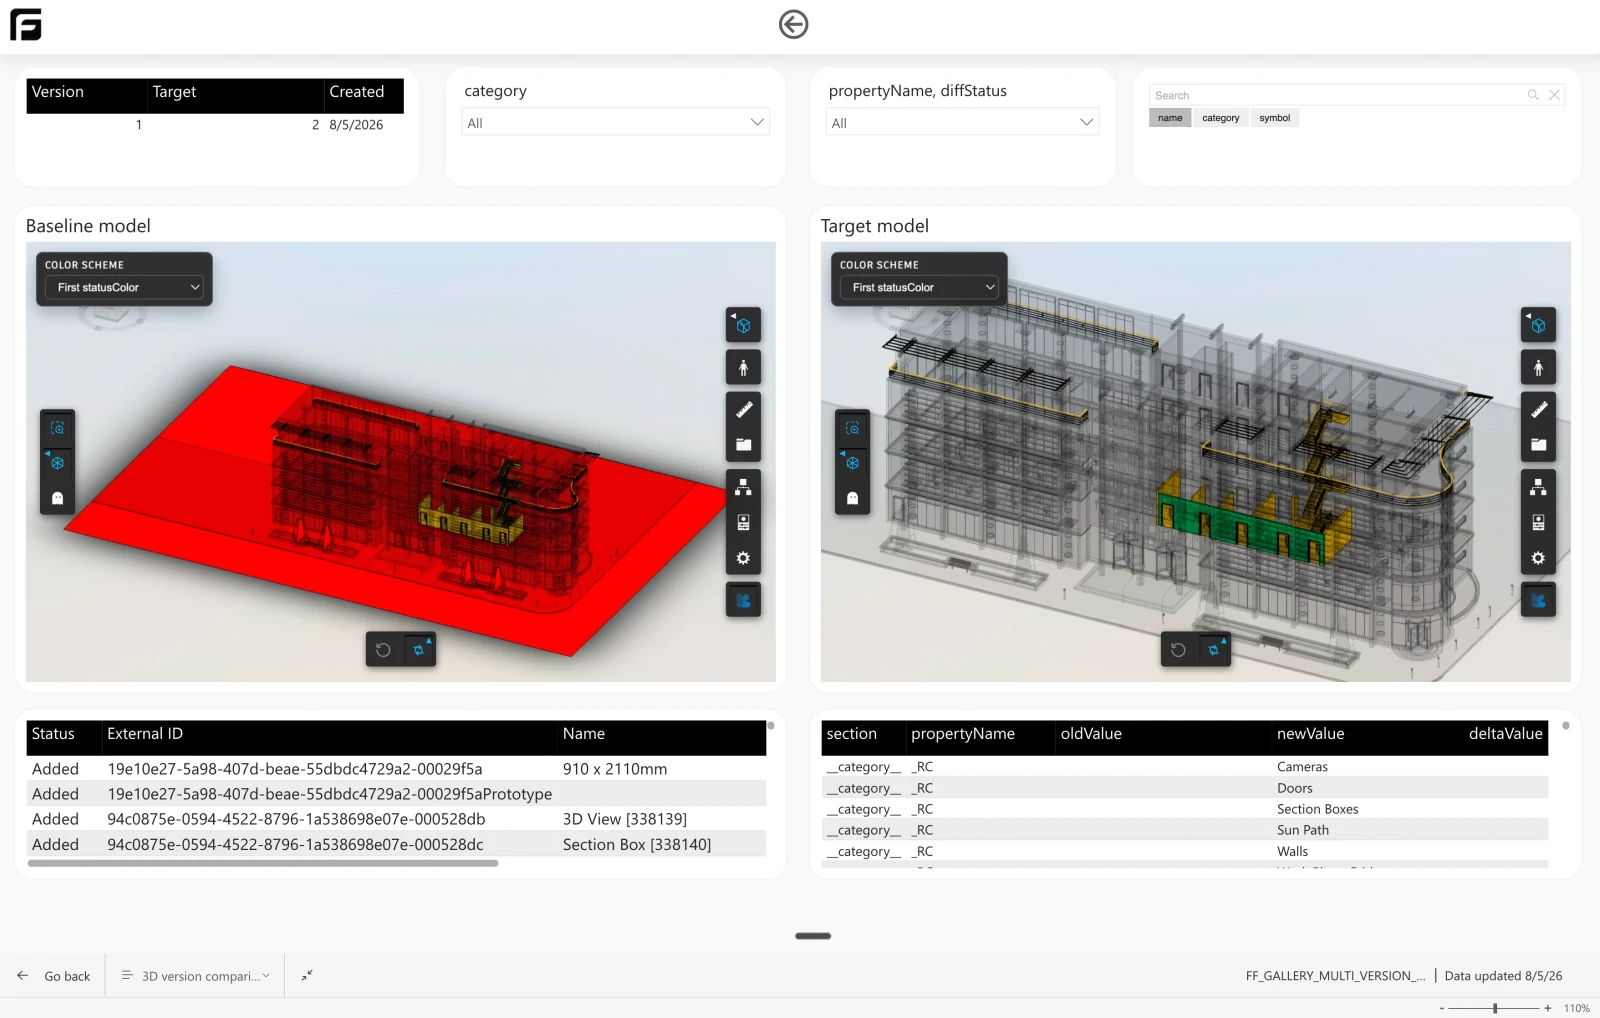
Federated Reports
Report across a whole coordination view, with every row tracing back to the model it came from.
Explore the template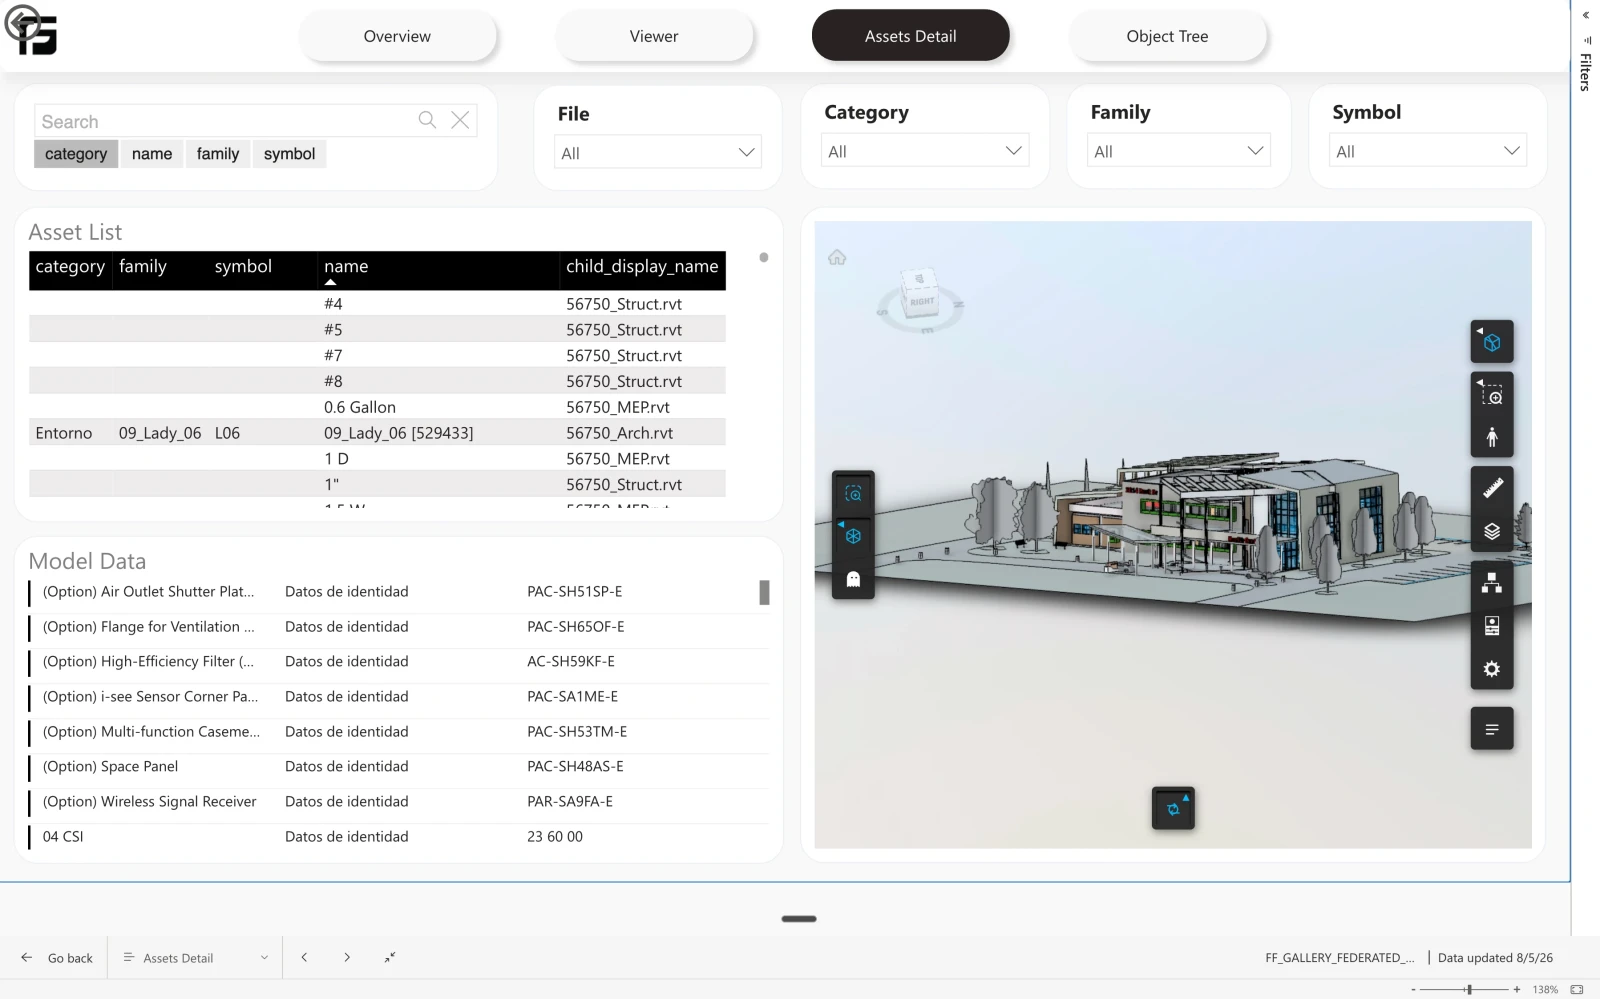
Excel for BIM
Work with model data in Excel, add your own columns, and bring those fields back into Power BI.
Explore the template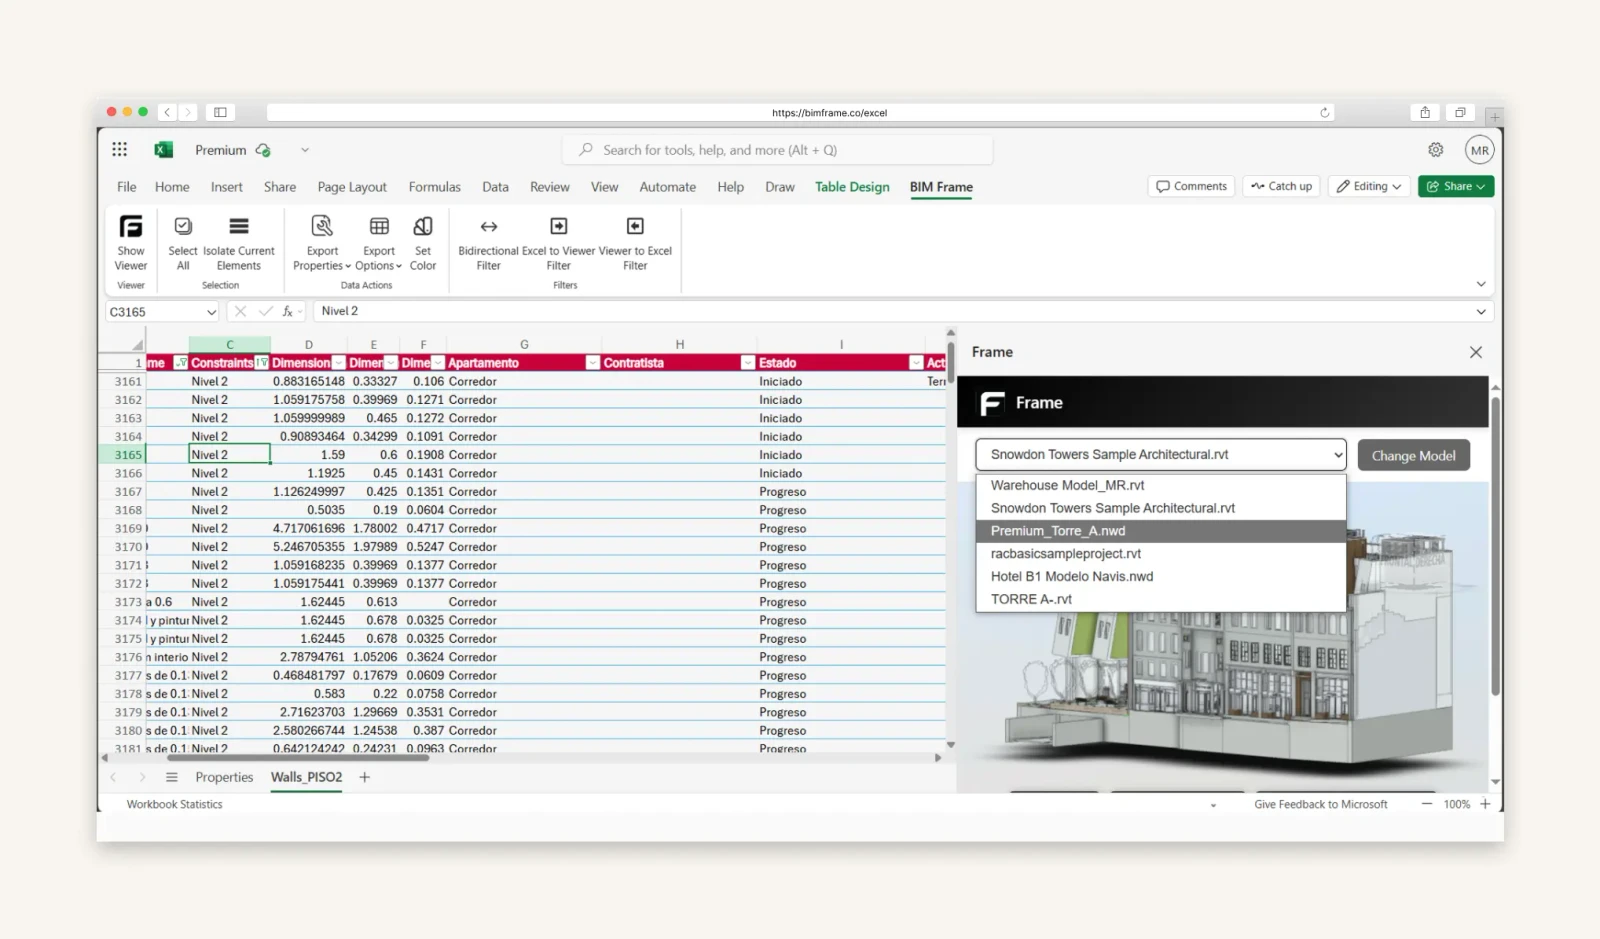
Quantity Takeoff & 2D-3D
Total the properties you care about against the model, with every number tracing back to the elements behind it.
Explore the custom example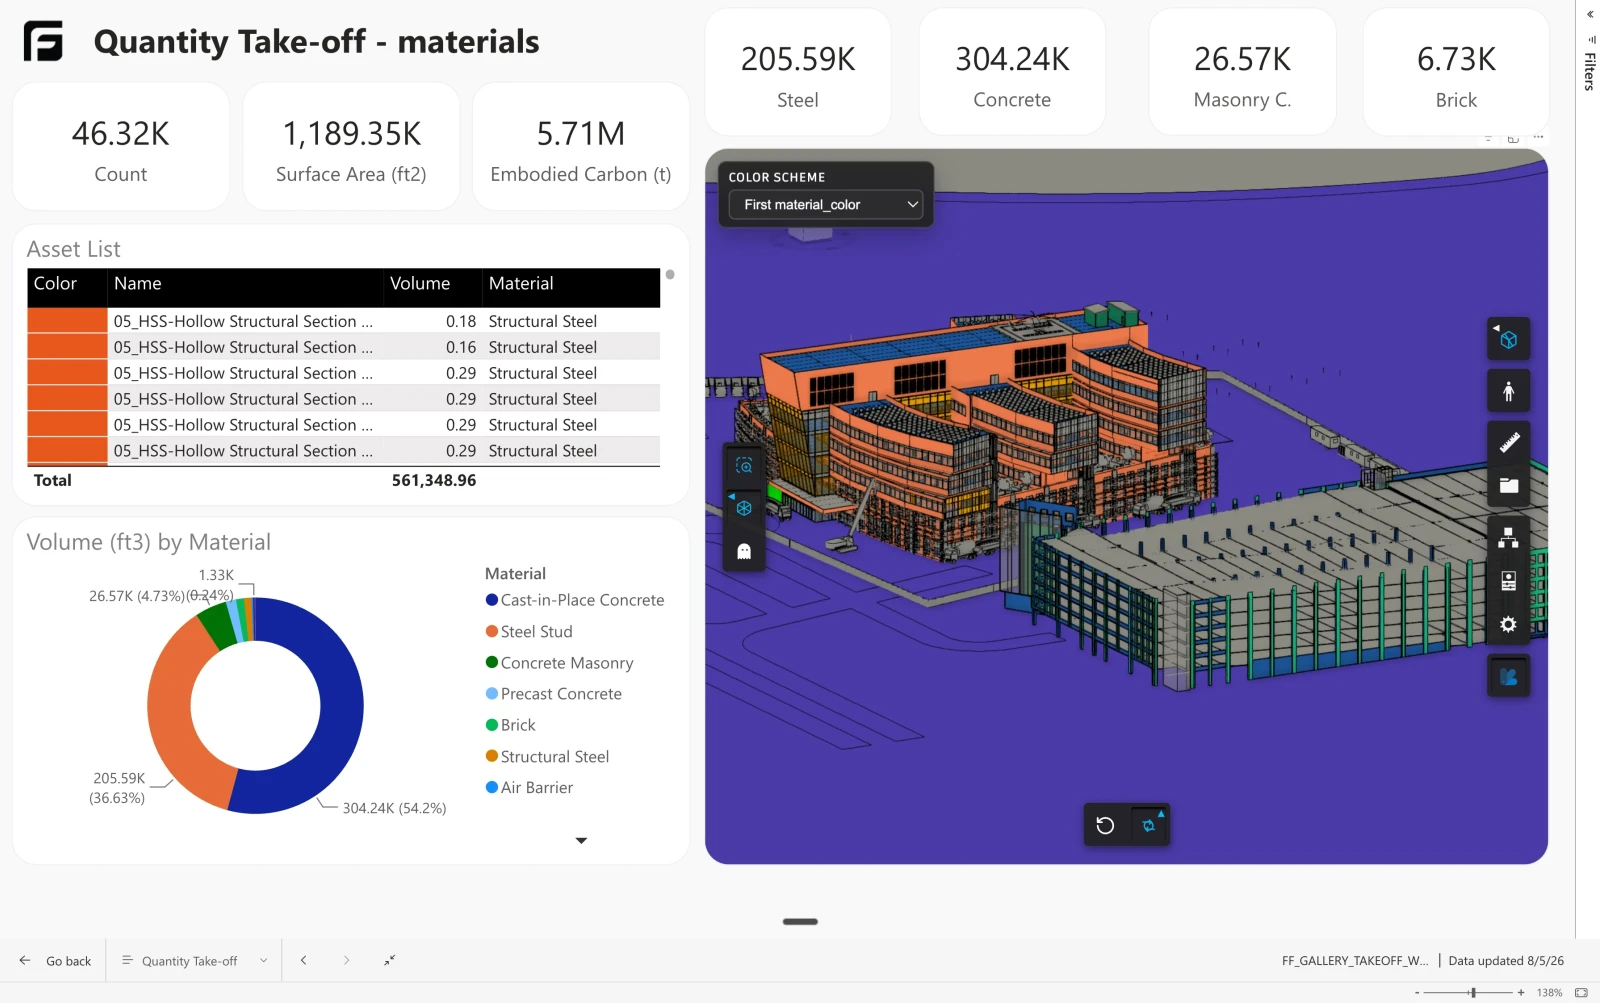
4D Scheduling
Tie programme activities to model elements and report on planned against actual progress.
Explore the custom example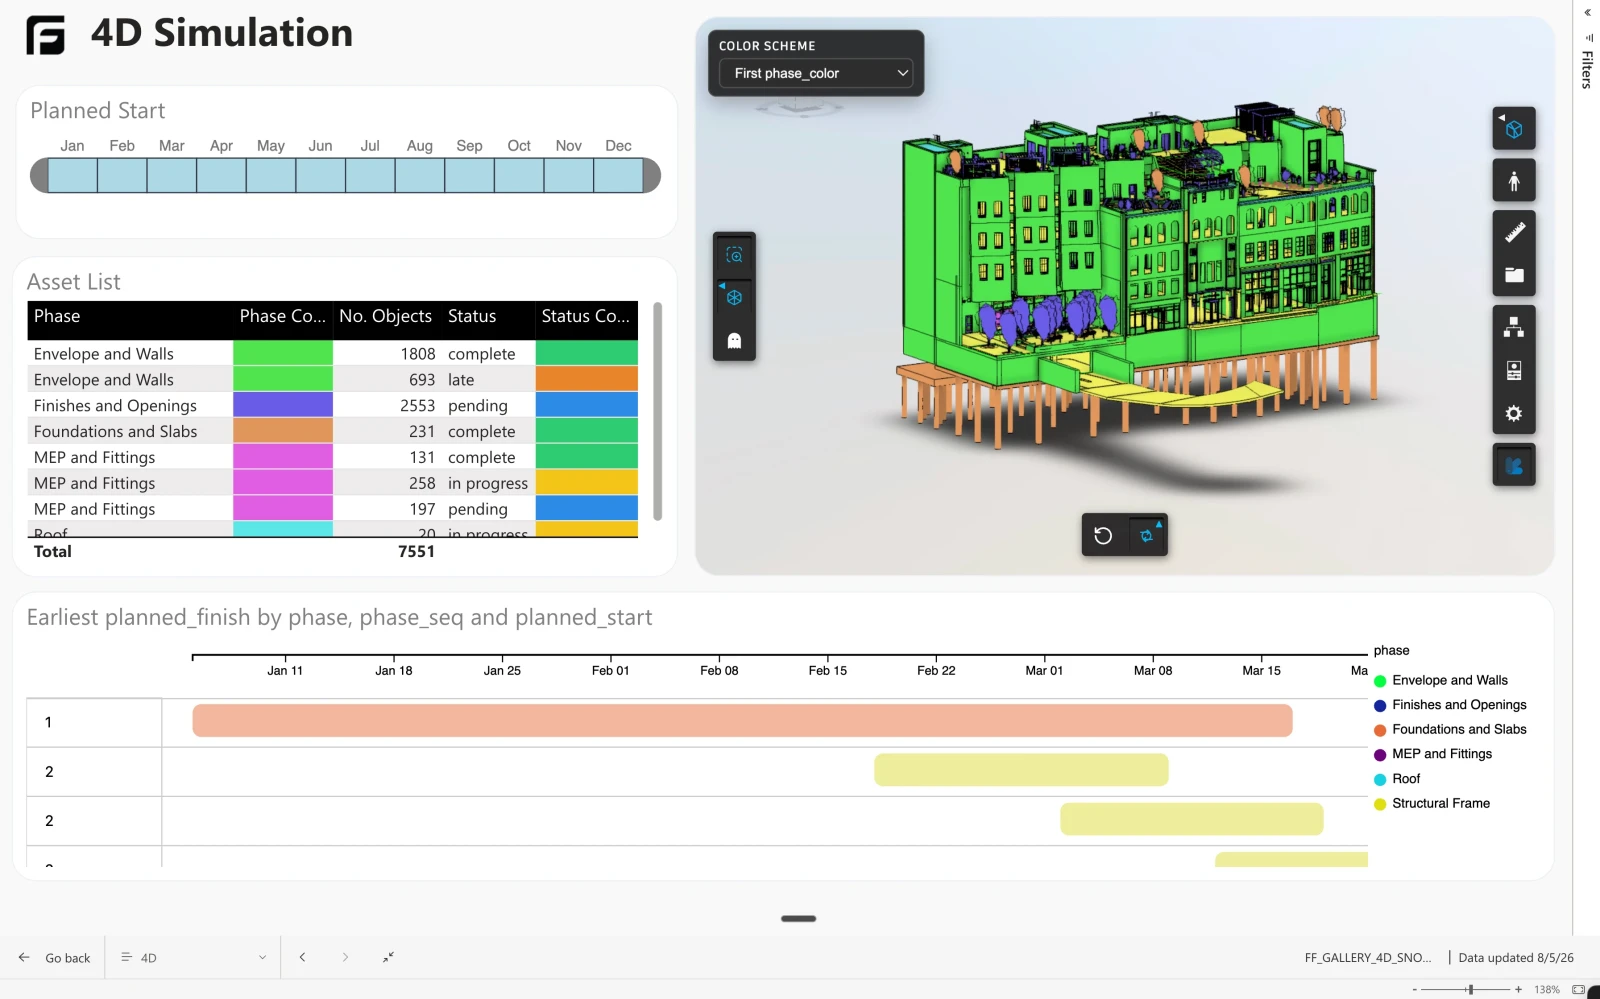
Lines of Balance
Track progress by location and work package, with the model colour-coded as the programme plays forward.
Explore the custom example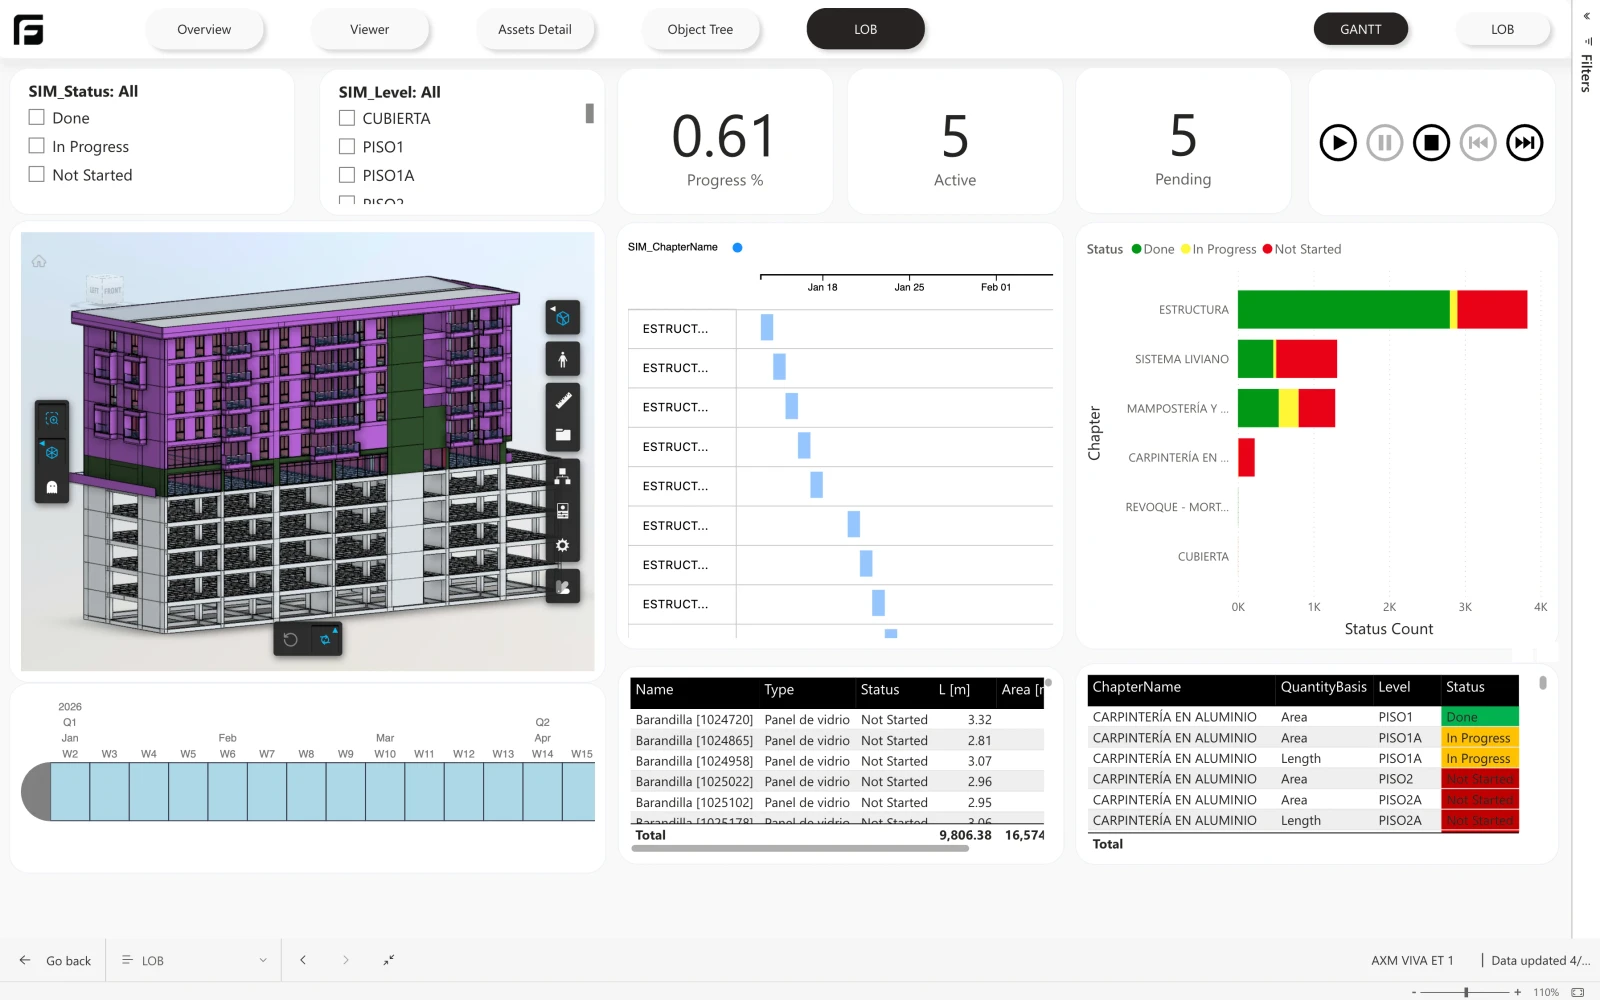
Facilities Management
Turn the handover model into an asset register the operations team can actually use.
Explore the custom example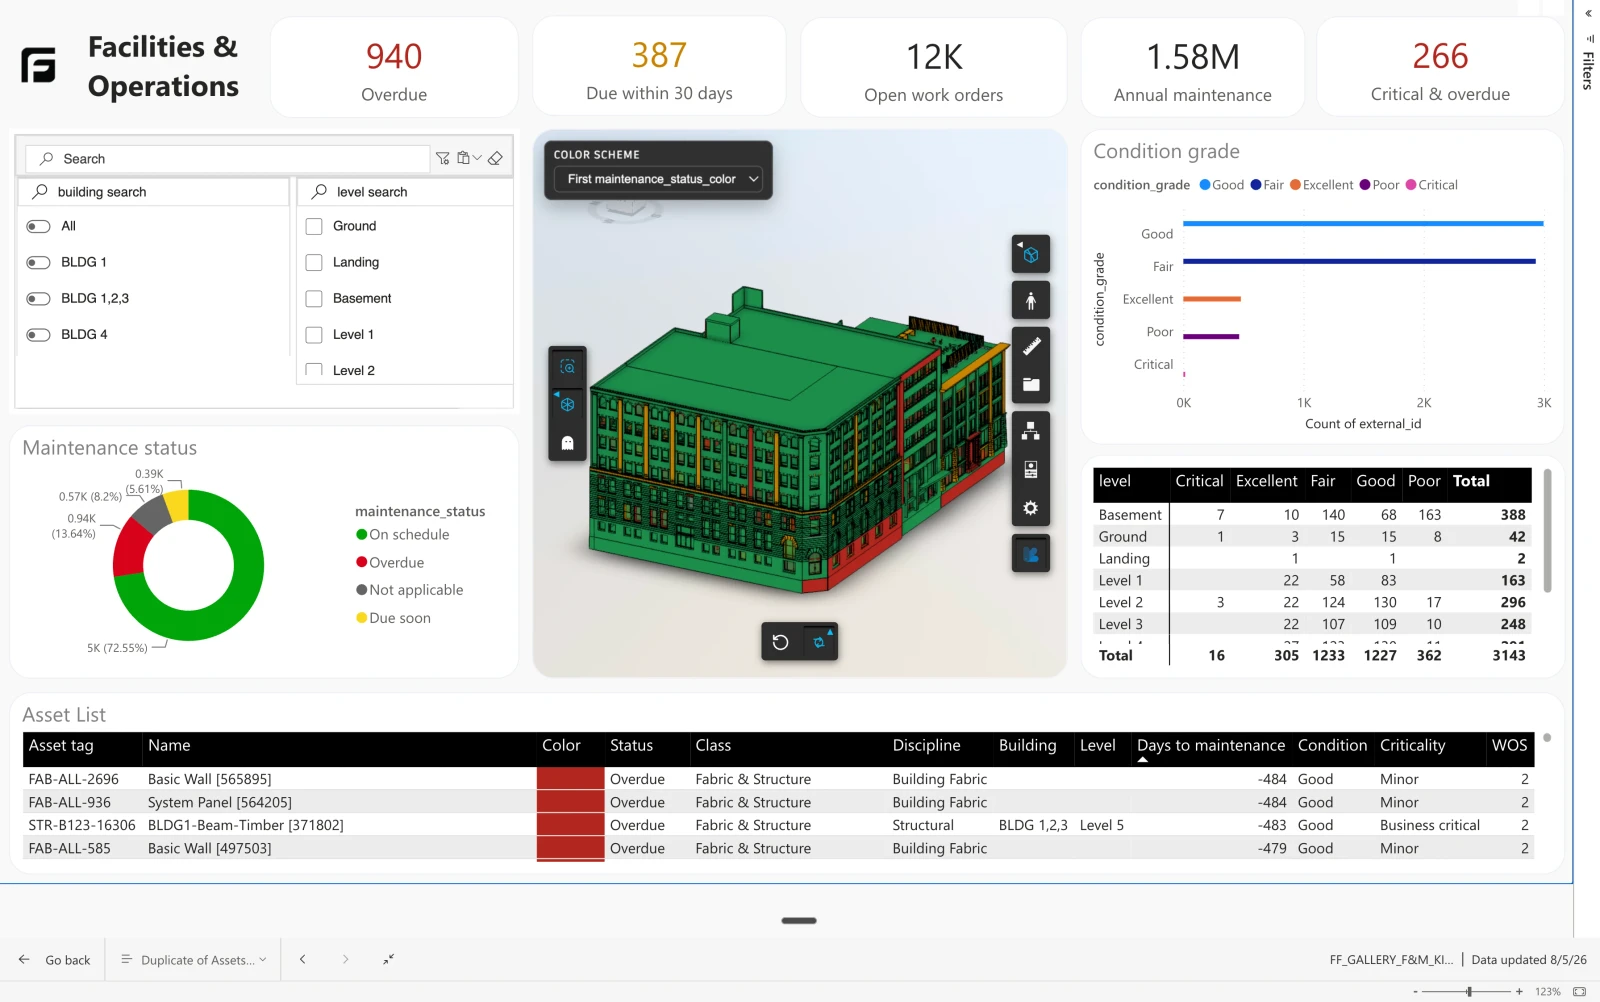
Room Analysis
Check areas, occupancy, and room data against the brief, and track them as the design develops.
Explore the custom example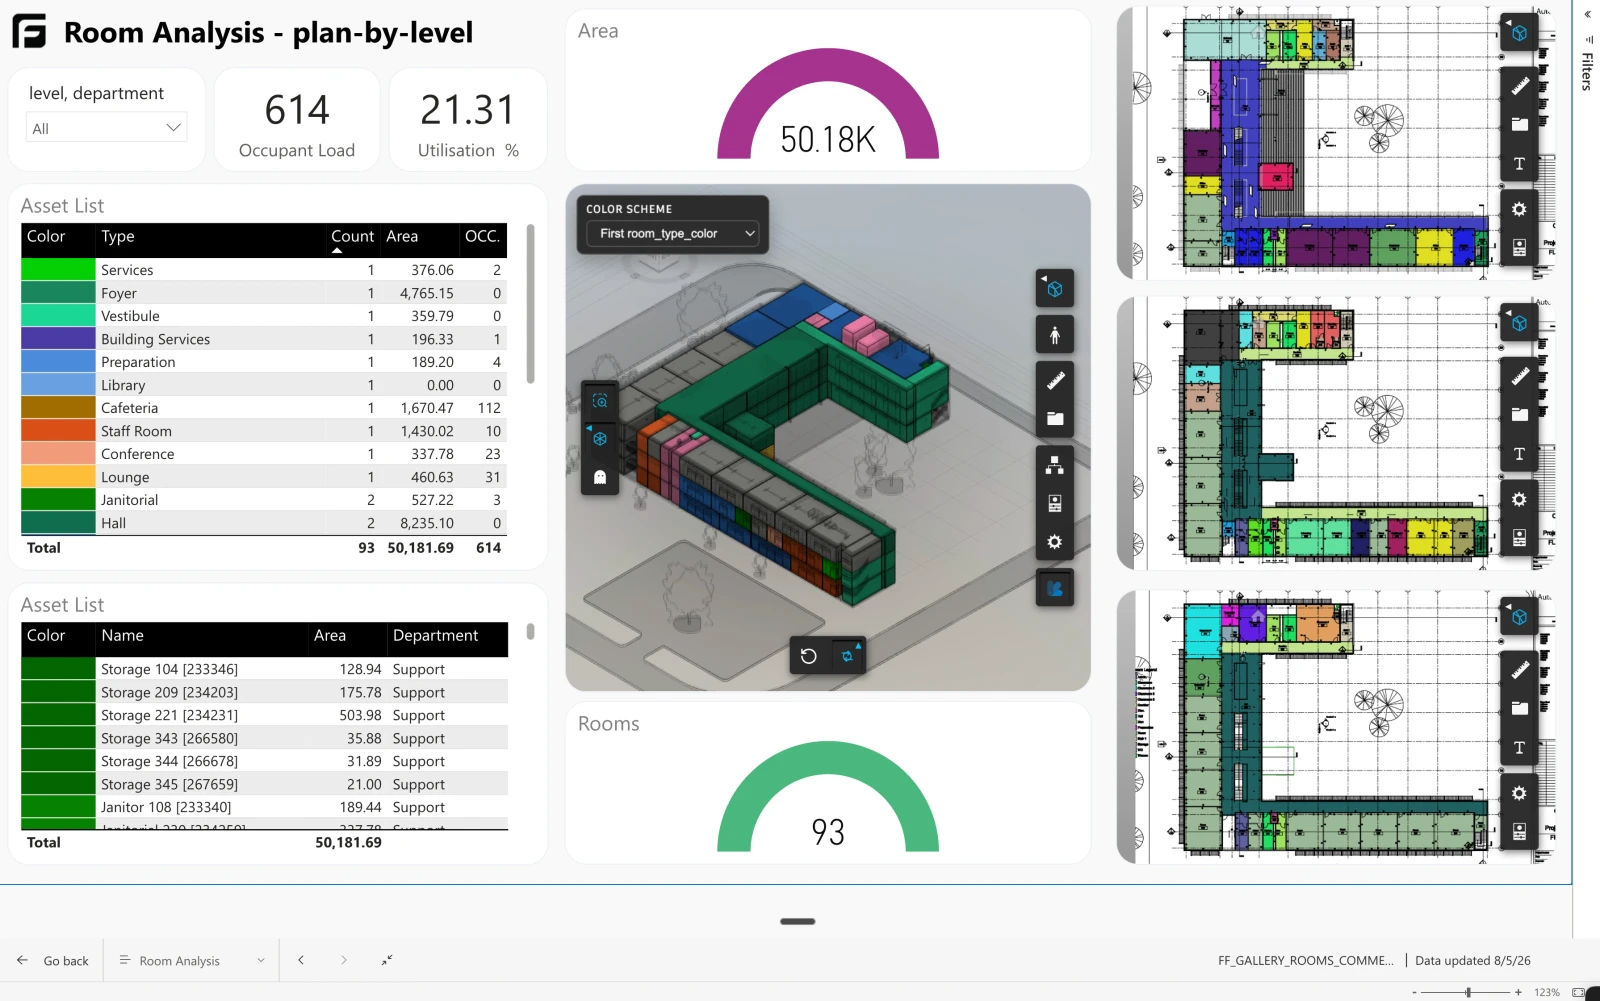
5D Cost
Attach rates to model quantities and track cost as the design changes.
Explore the custom example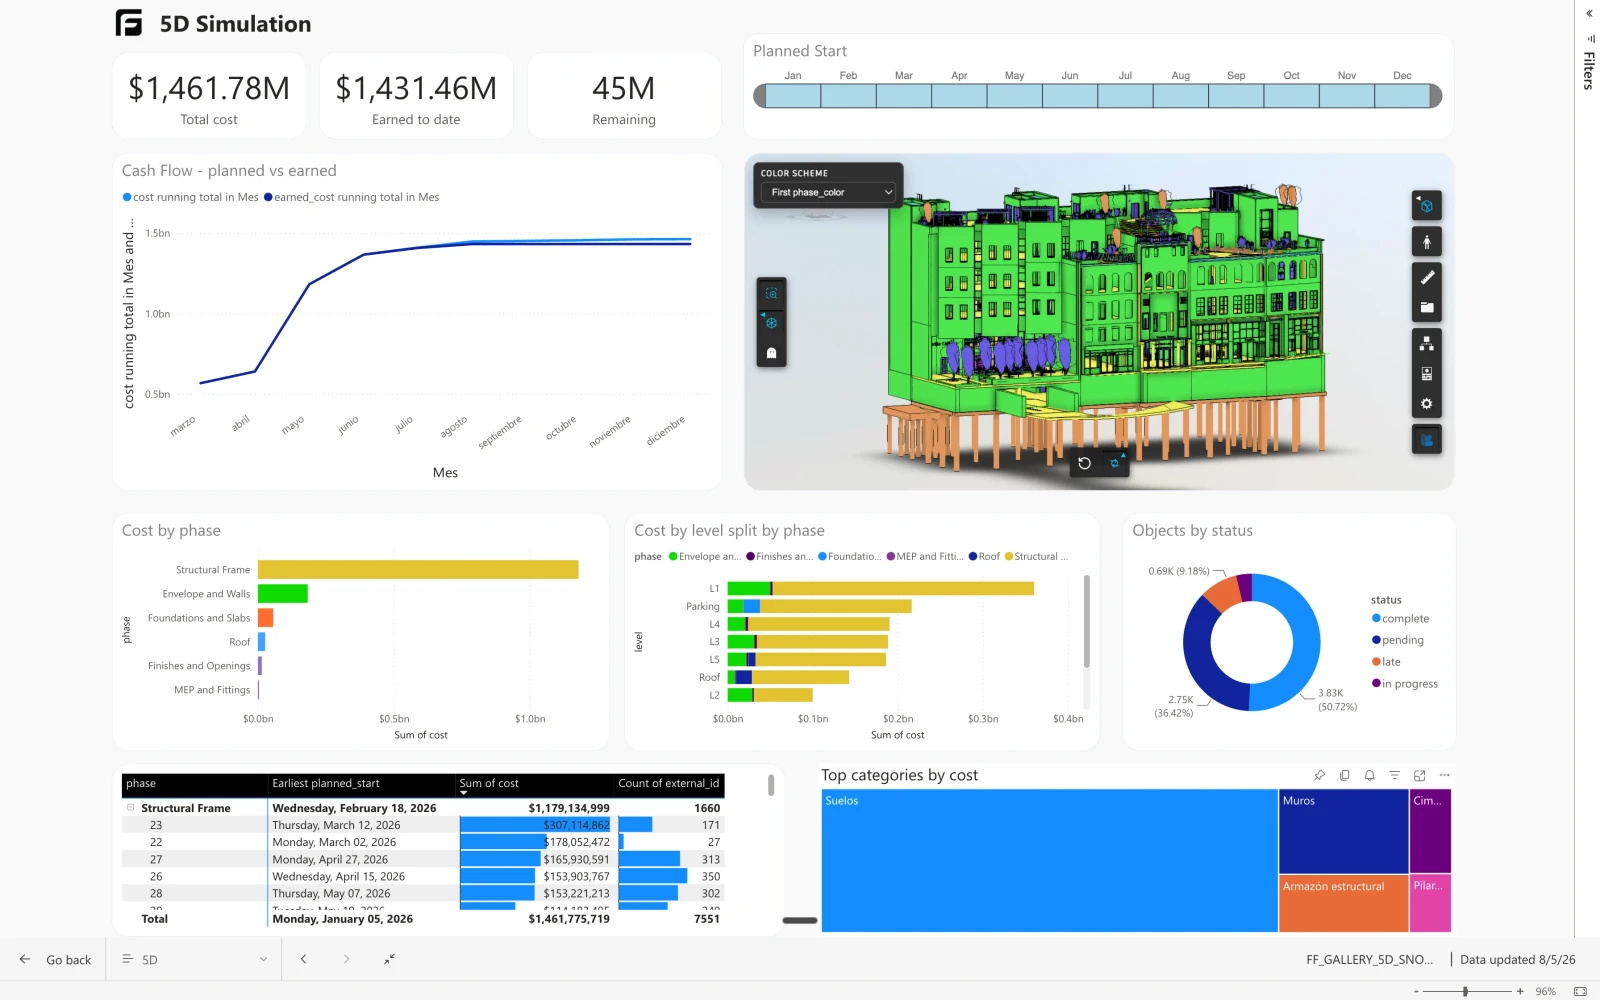
In development
Not available yet. Tell us what you need and it shapes what ships.
Build reports that drive action
Discover the benefits of Frame today.