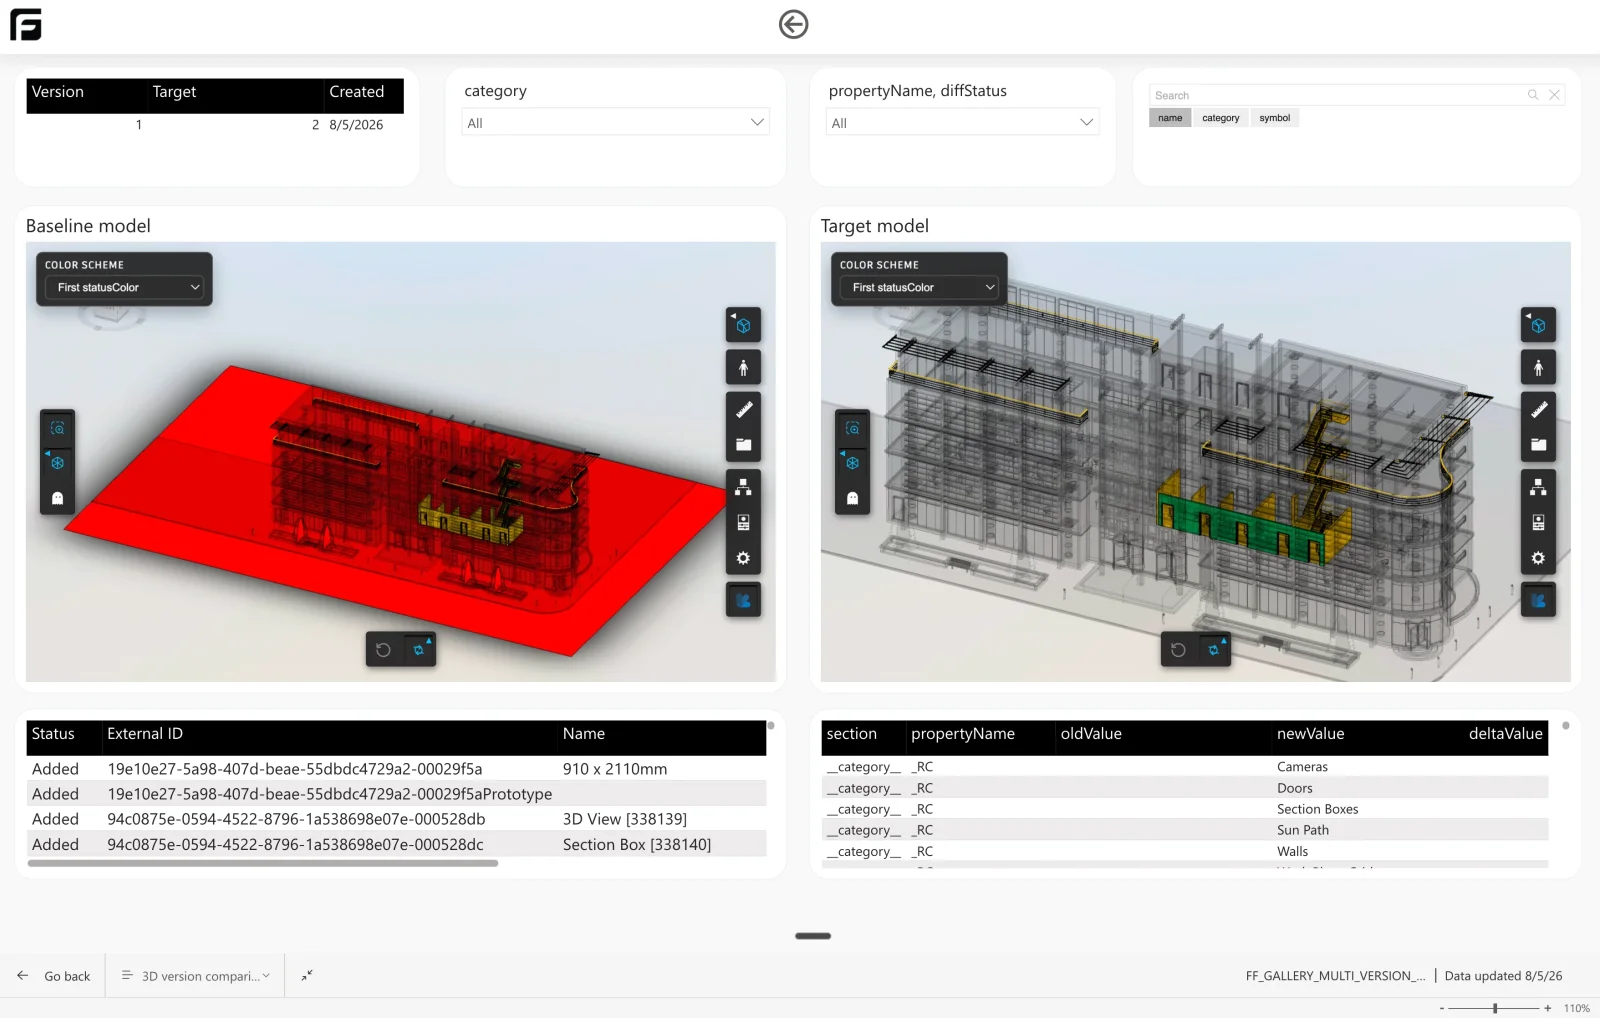
Version History

The whole lineage, not one snapshot.

Every consecutive change stitched into one model, so you can see the trend.

A single A/B comparison answers what changed last. It cannot tell you whether the model is stabilising, or when a value first started drifting.

How it’s made

Frame walks every consecutive pair in an ACC model’s lineage — all versions, the latest few, or a range you pick — and stitches the comparisons into one semantic model. Nobody else builds this; it is the reason the template exists.

How Frame builds it

Every pair in the lineage, not just the last one

The whole lineage v1 v2 v3 v4 v5 Every consecutive pair stitched into one model Drill through v2 → v3 exactly what moved Property time series one row per version
One A/B comparison answers what changed last. Computing every consecutive pair is what turns a pile of revisions into a trend you can chart.

Two things fall out of it. Drill through from the trend into any single step, v2 → v3, and see exactly what moved. And read any parameter as a time series: one row per element, per version, per property, with the value resolved to numeric, boolean, or text alongside its unit. That is how you chart the price of concrete across nine revisions, or find every element whose fire rating was edited after the tender issue.

Datasets in this report

FRAME_VERSIONS
Every version in the lineage, in order.
FRAME_COMPARISONS
One row per consecutive version pair, with its change counts.
FRAME_CHANGES
Element-level changes for every comparison in the series.
FRAME_PROPERTY_CHANGES
Property-level before and after for every comparison in the series.
FRAME_PROPERTY_HISTORY
One row per element, version, and property — a time series of any parameter across every version of the model, with the numeric value, unit, and value kind resolved.

Read more

Build reports that drive action

Discover the benefits of Frame today.