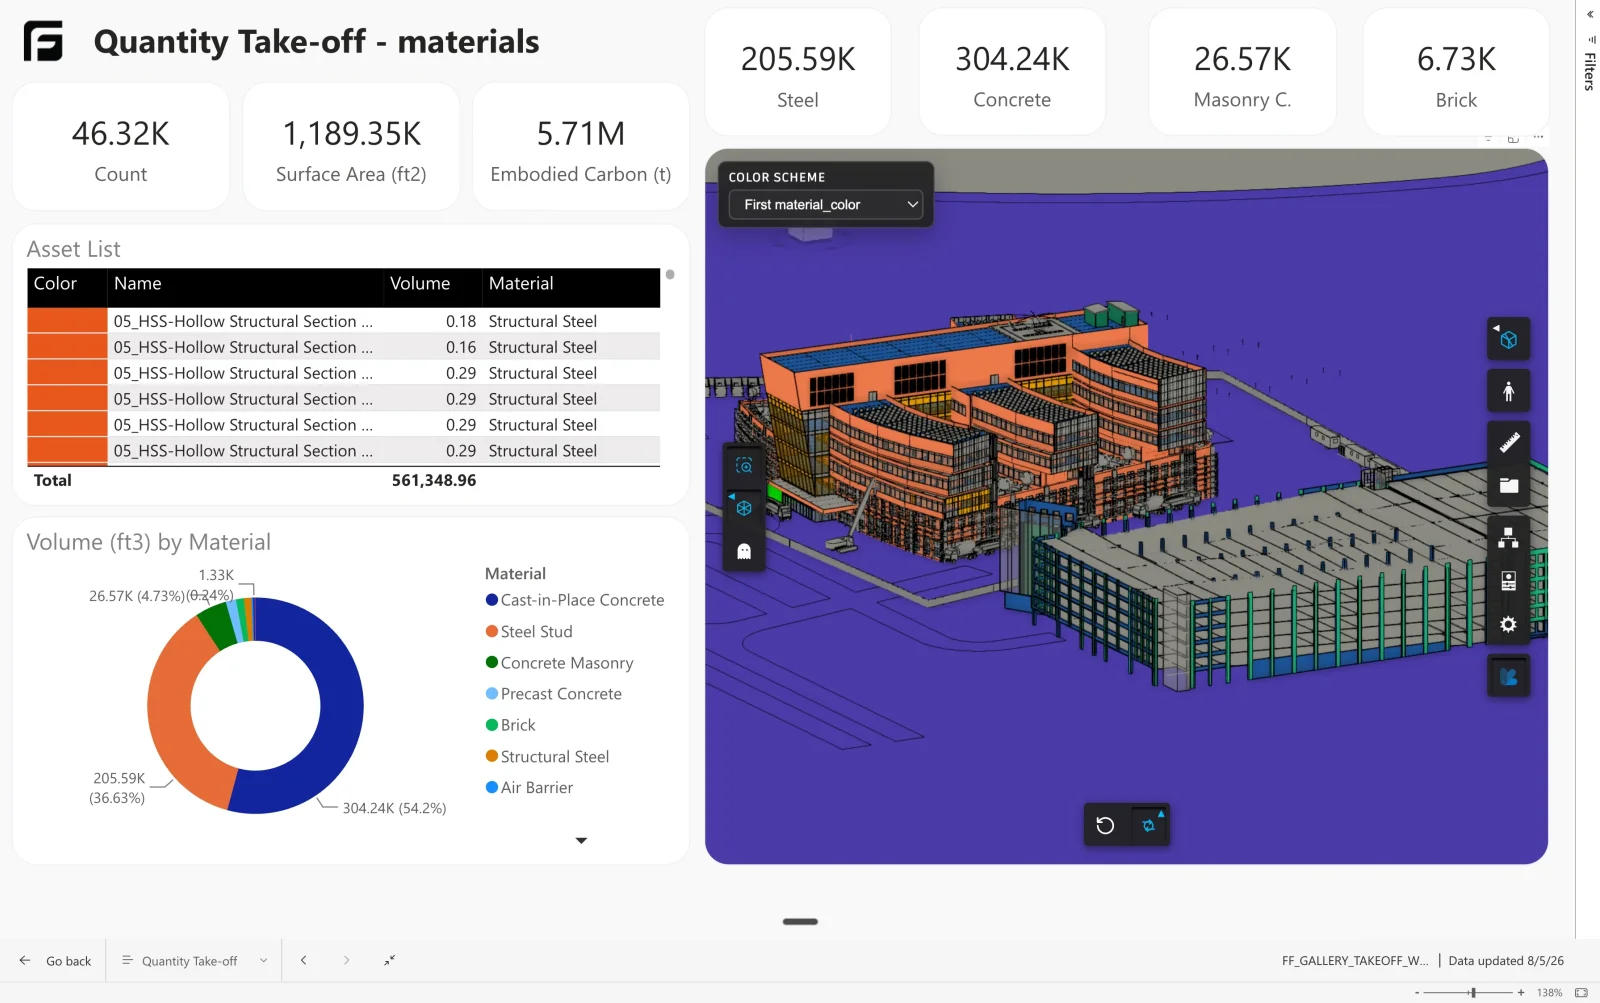
What this example includes
Review quantities beside an asset table and the model. Use a category or property filter to check the elements behind a total. The screenshot also shows carbon calculations; those require suitable factors supplied by the report author and are not calculated from geometry alone.
Inputs and access
This is a custom dashboard built from the Starter template, not a download of this exact report. You need a processed Revit or IFC model with the quantity properties you want to measure, Power BI Desktop, and access to the starting template. Contact Frame for help reproducing the example.
Build a quantity view
- Load your model’s starter report and keep the base asset and property queries.
- Choose one measurement, such as wall area in square metres. Filter out categories and units that do not belong in that total.
- Create a derived query with one row per measured element. Pivot the chosen property into a numeric column; retain the model identity and element identifiers.
- Relate the derived rows to the matching asset records. Check that the join does not multiply rows.
- Add a quantity measure, a category or level slicer, and an element detail table. Preserve the starter report’s viewer field mapping.
- Reconcile a small selection against the model before trusting the project total.
Missing properties, mixed units, duplicate elements, and different model versions can all change a takeoff. Refresh the prepared model data and report before issuing revised quantities. For rates and progress, continue to the 5D cost example.
How Frame builds it
This one started as the Starter template