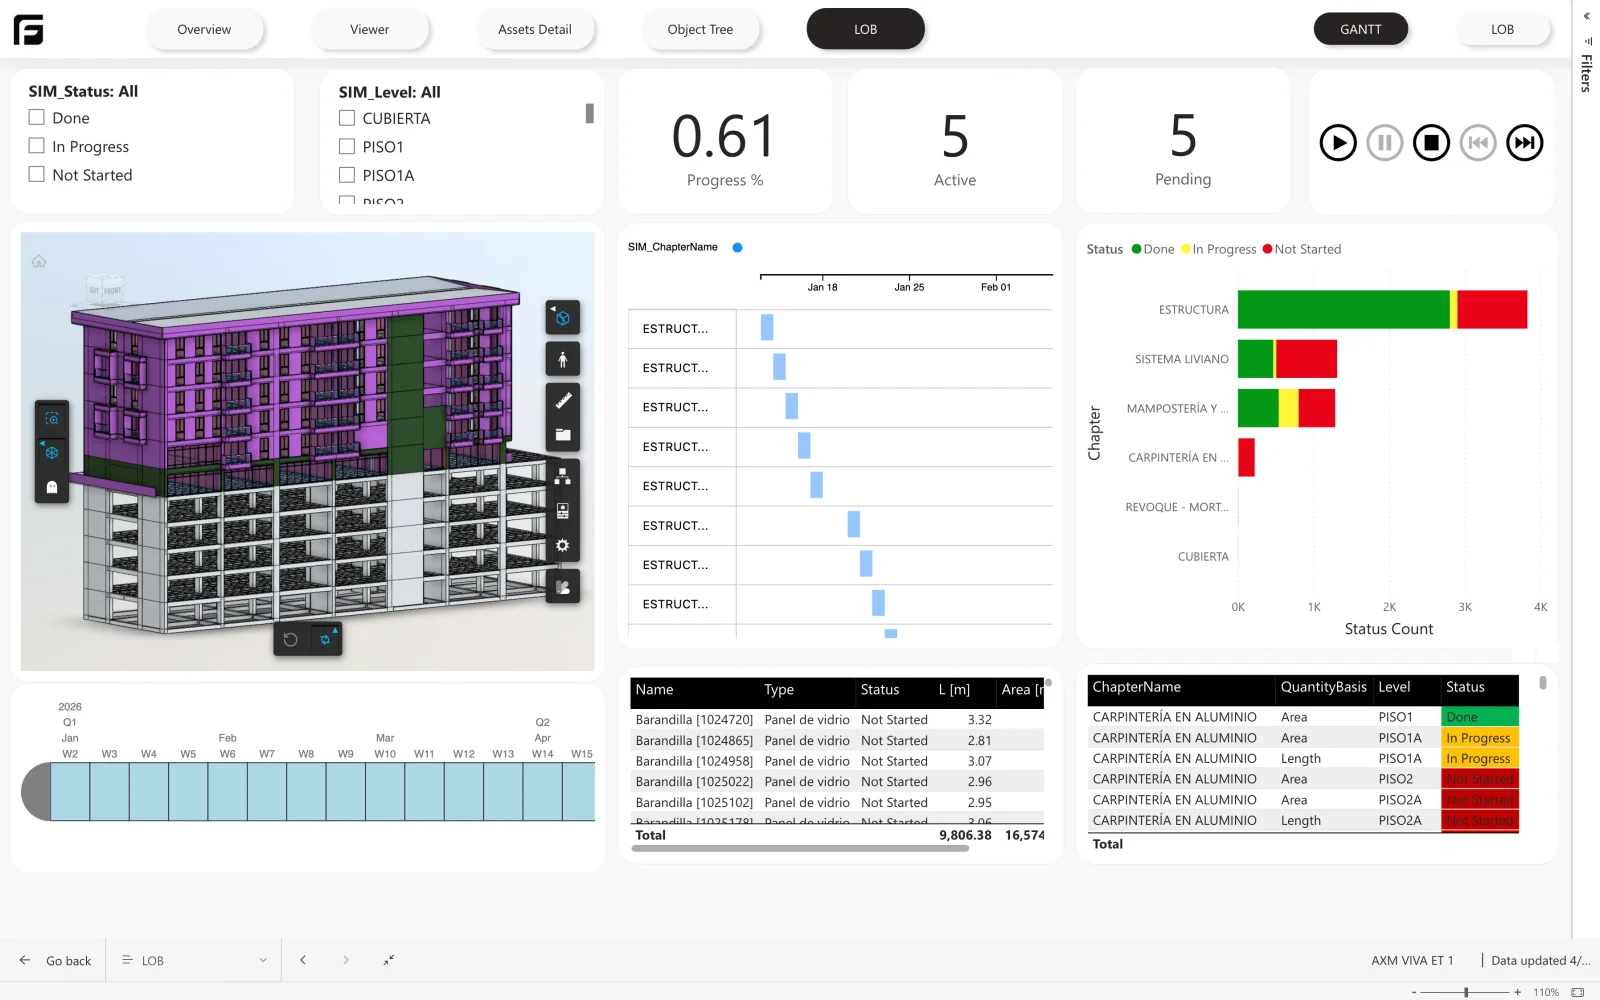
A Gantt chart tells you when a task is planned. It does not tell you where in the building the work has actually reached, which is the question the site asks every week.
How it’s made
This is the Starter template joined to progress data — ours came from a mix of Excel and the site’s own ERP. The model supplies the elements, their storey, and their quantities; the external systems supply status and dates; the external ID holds the two together.
How Frame builds it
This one started as the Starter template
Because quantities come through with their basis — length, area, count — progress is weighted by the work involved rather than by how many elements happen to be ticked off. Play the programme forward and the model recolours as each storey and work package completes, so a line of balance stops being a chart beside the model and becomes a view of it.