What the example shows
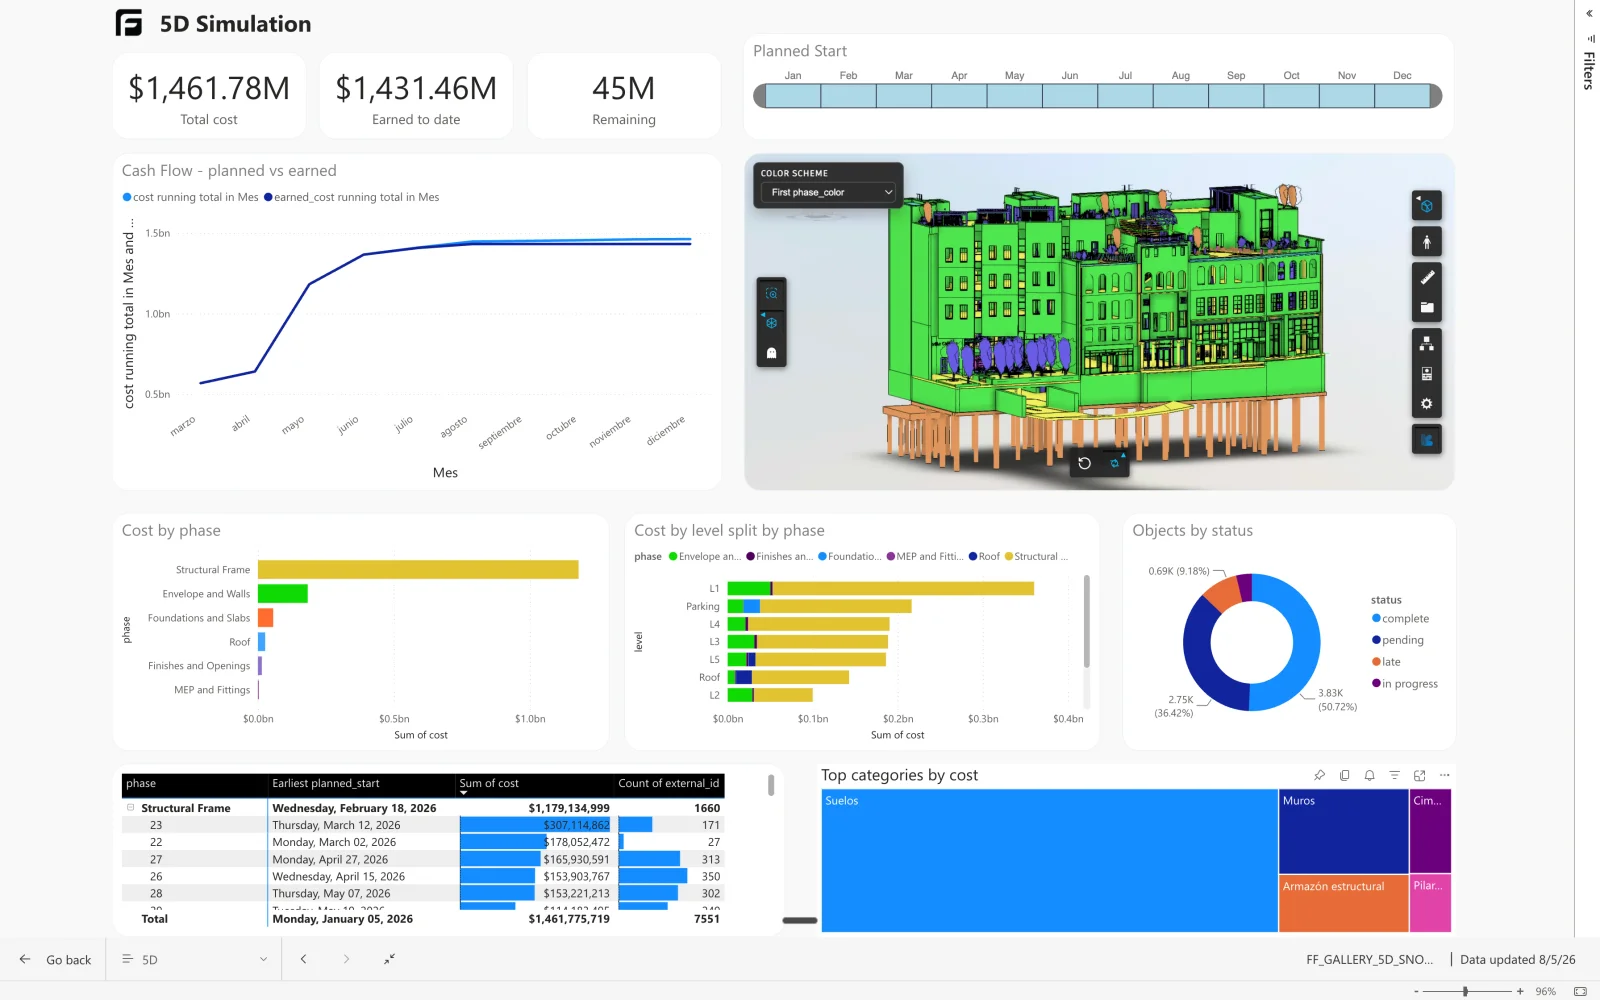
The public dashboard illustrates cost and progress alongside the model. Model quantities supply the physical scope; rates, budgets, dates, and progress records must come from your project team. A model update alone cannot tell you what has been installed or paid.
Inputs and access
This is a custom report built from the Starter template, not a download of this exact dashboard. You need Revit or IFC quantity data, a rate or cost table, stable element identifiers, and Power BI Desktop. Contact Frame for help adapting the example.
Build the cost model
- Start with a verified quantity table: one row per priced element, with consistent units.
- Prepare rates and approved progress in Excel. Include the model and element identity used by your asset table; document each rate’s currency and unit.
- Load the workbook into Power BI and check that each input row matches the intended model element exactly once.
- Calculate budget from quantity × rate. Calculate earned value from approved completed quantity × the same rate; keep actual spend as a separate input.
- Add cost and progress visuals alongside the model viewer. Verify a small work package manually before extending the report.
- On revision, refresh model data and the workbook, identify unmatched or removed elements, and review rate changes before comparing totals.
Follow the construction-control dashboard tutorial for sample rows, DAX measures, expected totals, and validation steps. The sample calculations illustrate a reporting method; they do not automate payment approval.
How Frame builds it
This one started as the Starter template