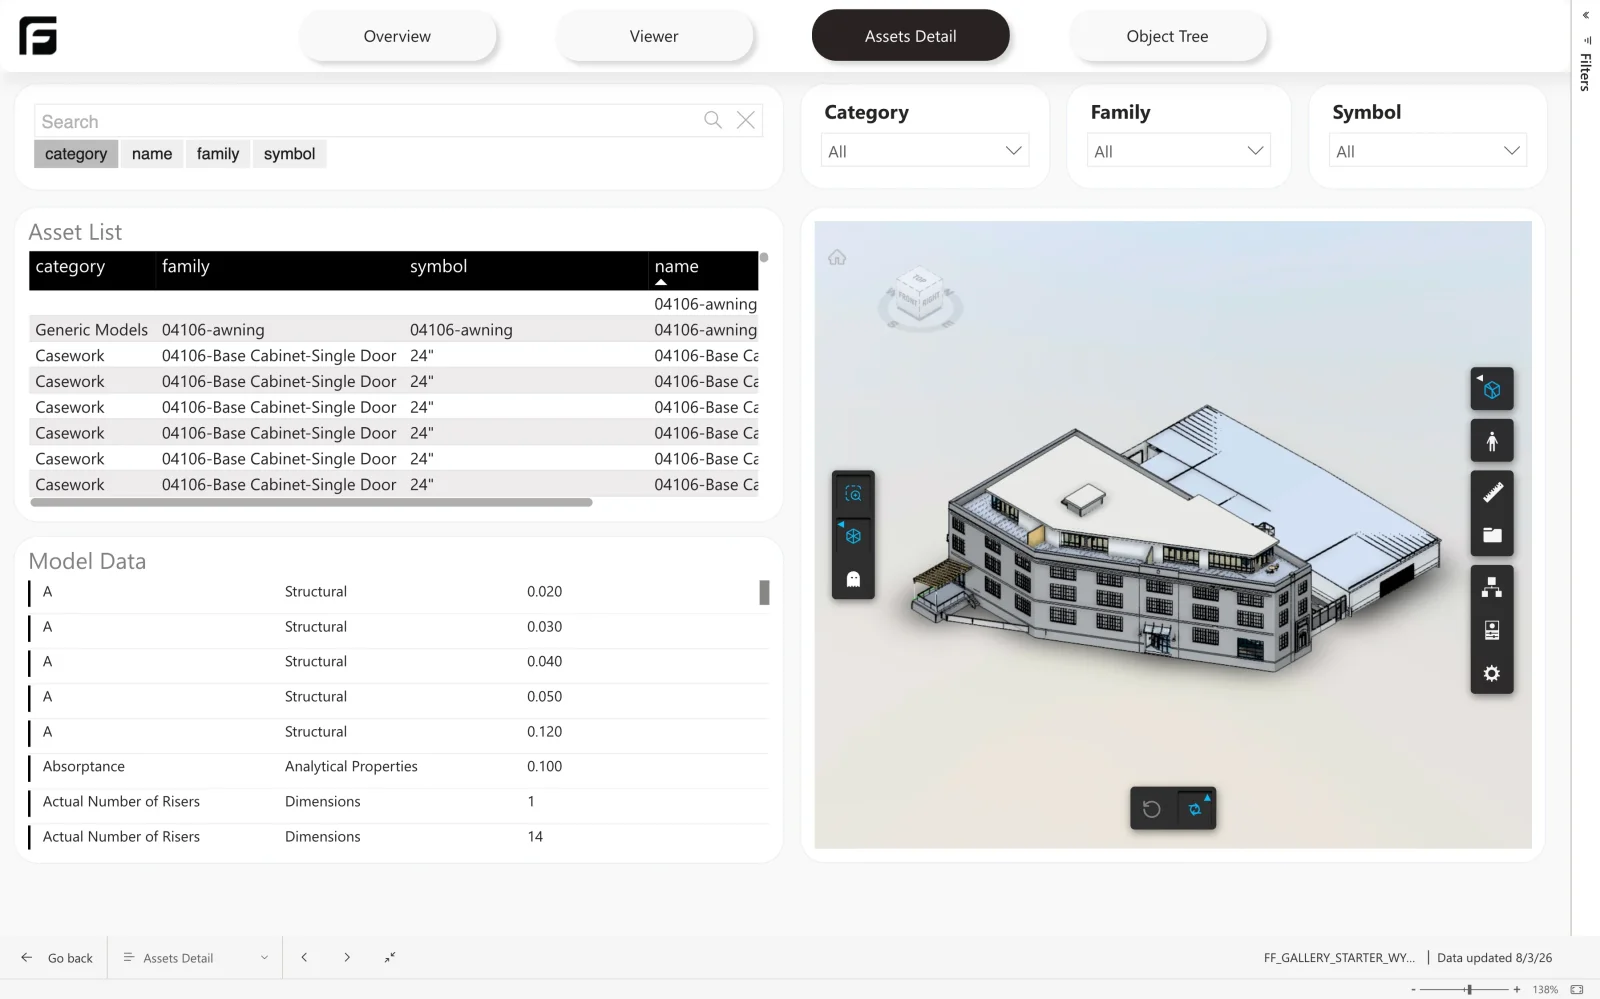
What you can review
Use the Overview to check element counts and categories, then inspect a selected row in the Viewer. Assets Detail and Object Tree help you verify the hierarchy before building your own measures.
Inputs and access
Use a processed Revit, IFC, or Navisworks model in Frame and Power BI Desktop. Choose a template compatible with the model’s processing engine. The public example above needs no Frame account; generating a report for your own model requires an account and the appropriate plan. The Frame-engine IFC workflow has its own starter template and free-plan limits.
Set up your report
- Open the model in Frame and confirm that its properties and report data are ready.
- Open the report template dialog, select the starter template offered for that model, and select the view if prompted.
- Create the report, download the
.pbitfile, and open it in Power BI Desktop. - Follow the generated template’s connection prompts. Wait for its tables to load before changing queries or visuals.
- Compare one category’s element count and one object’s properties with Frame. Select that object in the report and verify the viewer context.
Keep the base asset and property queries when creating derived tables. A property total is only meaningful when its units and scope agree. See the construction dashboard tutorial for adding cost and progress inputs.
Refresh and sharing
A model update and a Power BI refresh are separate steps. Prepare the updated model data in Frame, refresh the report, and verify the selected version. Sharing through Power BI Service also requires the appropriate Microsoft access and data-source configuration. Check Frame plan limits before rolling out reports to a team.
How Frame builds it
From model file to a report you own