Last updated
Autodesk Construction Cloud (ACC) Power BI Integration Guide
Connect Autodesk Construction Cloud (ACC) models and issues to Power BI: what data to include, how Frame compares with Data Exchange, and step-by-step setup.

Frame Team
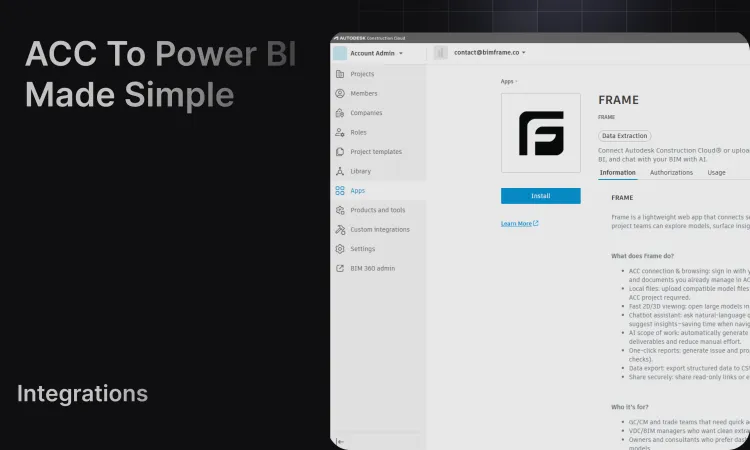
Autodesk Construction Cloud (ACC) holds the models, issues, and versions most project teams report on. Getting that data into Power BI in a shape a BIM team can use is still the hard part. This guide covers why teams connect ACC to Power BI, what data belongs in the report, where Frame fits next to Autodesk’s own connector, and a step-by-step walkthrough that ends with a report you have checked against the source.
Autodesk now groups its construction cloud products under the Autodesk Forma name, but most teams still say ACC, BIM 360, Autodesk Docs, or Model Coordination, and this guide uses ACC. For the Forma-specific view, see Autodesk Forma to Power BI.
Why Connect Autodesk Construction Cloud to Power BI?
ACC centralizes project models and coordination, but that data often stays inside the platform. Power BI is strong at visualization, analysis, and reporting, yet connecting it to BIM data has traditionally meant custom development, manual exports, or connector flows that do not match how BIM teams review models.
A good ACC to Power BI workflow gives you:
- Consistent reporting across projects: the same template structure on every ACC project, so stakeholders find the same metrics in the same place.
- Current model data: new ACC model versions can be ingested and picked up by a Power BI refresh, instead of re-exporting spreadsheets by hand.
- Model-aware review: every total stays linked to the model objects behind it, so a reviewer can check a number in the 3D view.
- Reports anyone can read: BIM properties turned into quantities, issue status, and model health views that do not require opening Revit or Navisworks.
Ways to Get ACC Data Into Power BI
Autodesk’s Data Exchange connector for Power BI
Autodesk’s Data Exchange connector loads data from Autodesk Data Exchanges into Microsoft Power BI:
- A Data Exchange is created in Autodesk Construction Cloud, often from a Revit 3D view or another BIM data source.
- The Data Exchange stores a subset of the design or model data that can be shared with external tools.
- The Autodesk connector, installed in Power BI, adds a data source that connects to those Data Exchanges.
- Once connected, the data is imported into Power BI, where it can be transformed, filtered, analyzed, and visualized.
- An Autodesk Viewer visual can be added to the report for 3D context.
- Data Exchanges can be set to update, so reports reflect later design changes.
The connector gives you the exchanged data; the report structure is up to you. You choose which properties to load, shape the tables, account for Revit, IFC, and Navisworks differences, and build the visuals. That suits teams with Power BI expertise and a narrow, well-defined data set.
Frame’s approach
Frame connects to your ACC projects through your Autodesk account. Your source files stay in ACC. Frame reads the model data needed for reporting and generates structured datasets and Power BI templates from it.
The goal is not just to export rows. It is a repeatable reporting layer for Revit, IFC, Navisworks, ACC issues, model versions, and assets.
What Frame provides for Power BI:
- Report templates: generated
.pbitfiles with visuals, measures, and relationships already set up. Browse them in the dashboard gallery. - Structured datasets: clear
FRAME_AssetsandFRAME_Propertiesqueries that report authors can duplicate and shape into custom tables, instead of starting from raw Autodesk export structures. - A 3D viewer inside Power BI: built on Autodesk Viewer technology, with saved views, isolated element sets, color rules, markers, 2D sheets, and selection that moves both ways between the model and other visuals.
- Large-model architecture: model data is prepared before the template opens, so large Revit models and federated ACC views do not push heavy transformation work into Power BI.
When to use which
Autodesk Data Exchange is useful when a team wants to share a curated subset of design or project data between tools. Frame is focused on model-aware reporting: large BIM models, Power BI templates, custom datasets, and viewer interaction.
Use a Data Exchange workflow when the team needs a specific exchange of design data. Use Frame when the dashboard needs Revit or ACC model objects, their properties, saved viewer state, and a Power BI dataset that is already shaped for construction reporting. Large models are usually the deciding factor: Frame does the heavy model preparation before the report opens, then serves the report tables and viewer state to the dashboard.
What Data Should Go Into the Power BI Model?
The most useful ACC dashboards usually combine a few stable data families:
- Assets and elements: object identifiers, category, family, type, level, source model, and display names.
- Properties: Revit parameters, IFC properties, Navisworks attributes, and values grouped into a table that can be filtered and duplicated.
- Versions: model publish dates, active versions, and comparison context.
- Issues and coordination data: status, assignee, priority, due dates, locations, linked objects, and resolution metrics.
- Viewer state: saved views, isolated element sets, color rules, and marker context that can be reused in review meetings.
Instead of leaving every report author with a raw model export, Frame gives the
report a clearer starting point. The common pattern is to keep FRAME_Assets
and FRAME_Properties as the base queries, duplicate them for custom report
tables, and build visuals from those prepared tables. That keeps the dataset
readable and reduces the chance that a large model becomes hard to refresh or
maintain.
Why the Viewer Matters Inside Power BI
An ACC Power BI dashboard should not only show totals. It should let the team verify the model objects behind those totals.
Frame’s Power BI viewer is based on Autodesk Viewer technology and extended for dashboard review work. Teams can apply colors, place markers, save views, save isolated element sets, and preserve color states for future meetings. The viewer also interacts with other Power BI visuals: a chart selection can isolate objects in the model, and model selections can drive the report context.
For a deeper look at this workflow, see Autodesk Viewer in Power BI: Custom BIM Models Inside Reports.
How to Connect Autodesk Construction Cloud to Power BI with Frame
This walkthrough connects an ACC model to Frame, creates a Power BI report, and checks it against the source. Choose a model properties report or an ACC issues report according to the question you need to answer. Connecting a model does not automatically bring every ACC project dataset into Power BI.
1. Check access and choose the report
You need access to the Autodesk project and source models, a Frame account with
access to the required report workflow, and Power BI Desktop to open the generated
.pbit. Issue reporting also requires access to the project’s issues. Review
current plan access before starting a production workflow.
Scroll horizontally to see all columns.
| Goal | Starting point | Source to verify |
|---|---|---|
| Review categories, properties, and model elements | Starter template | A known element and property in the selected model/view |
| Review issue status, ownership, and due dates | ACC issues template | A known accessible issue in the same ACC project |
The Power BI feature page explains the broader workflow. For a local IFC file, use the separate IFC to Power BI path.
2. Connect Autodesk and select a source
In Frame, connect your Autodesk account and complete the Autodesk sign-in and authorization flow. Use an account that can already open the intended project and model in Autodesk. This workflow uses your Autodesk connection; it is not the local-file workflow that uses separately configured APS credentials.
Browse to the project and select a Docs model, or select an available federated Model Coordination view. Confirm the project, source, and version before adding it to your Frame library. A federated view and one constituent model are different reporting scopes; their element totals should not be expected to match.
If a project or folder is missing, first check the connected Autodesk identity and its access in Autodesk. Reconnecting cannot grant permissions the account does not have.
3. Wait for model data, then create the report
Open the added model in Frame and wait for processing and report data preparation to finish. Confirm that the intended view opens and that its properties are available. An available 3D preview alone is not proof that every analytics artifact is ready.
Create a report for the model and choose the starter template and applicable
view. Open the generated .pbit in Power BI Desktop, complete the connection
prompts, and allow the queries to load. Keep the generated connection parameters
intact unless you are deliberately configuring another source.
Treat generated templates and connection credentials as private project artifacts. Share a report through your organization’s approved Power BI access workflow, rather than uploading a configured template to a public repository.
4. Validate a model report against Autodesk
Use a small source check before customizing the report:
- Identify one element in the selected Autodesk model or federated view.
- Find the same element in the report’s property data. Compare an identifiable property, such as its category, type, or a project parameter.
- Check the active model/view and filters before comparing element totals.
- Select a category or element in the report and verify the expected interaction with the report’s model context.
Do not use total row count alone as a model-element count: a properties table can contain several rows per element. Use the template’s element identity and report grain when validating totals.
The starter report preview shows the report layout.
Once the source checks pass, save your working report as a .pbix and add the
project-specific visuals you need.
5. Add ACC issue reporting when needed
For issue reporting, synchronize the project’s issues in Frame before creating an ACC issues report. Choose the ACC issues template for the appropriate source. The ACC issues example describes its inputs and setup.
Pick one known issue and compare its title or identifier, status, assignee, and due date with ACC. Then inspect status totals under the same filters. An issue without a usable model location can still contribute to a table or count; a missing 3D marker does not necessarily mean the issue is missing from the data.
This report covers the available issue dataset. It does not imply that RFIs, submittals, project costs, or schedules are included. Bring those sources into a custom report separately when required and define how they relate to models.
6. Test the refresh path
Autodesk source changes, Frame ingestion, and Power BI refresh are separate stages. Where configured, Autodesk events can trigger ingestion; an explicit refresh may also be needed. Check that Frame has processed the intended version or synchronized issue changes before refreshing Power BI.
For a repeatable test, use a legitimate source update with a known value, confirm that value in Frame, and then refresh the report. If it stops at one stage, investigate that stage rather than rebuilding the visuals.
Before scheduling refresh in Power BI Service, verify credentials and access to all report sources. A successful Desktop refresh does not guarantee that the Service can access a local Excel file or use the same authentication setup.
Troubleshooting
Scroll horizontally to see all columns.
| Symptom | First check |
|---|---|
| Project or model missing | Connected Autodesk identity, project permissions, folder access, and selected source |
| Report cannot be generated yet | Model processing and analytics preparation status |
| Counts differ from Autodesk | Model version, federated versus individual scope, filters, and table grain |
| Issues absent | Project issue access and completion of issue synchronization |
| Issue has no 3D marker | Whether the issue has a location that maps to the selected model/view |
| Report shows old values | Source update → Frame ingestion → Power BI refresh, in that order |
Example Use Cases
- Quantity takeoff: total the properties you care about against the model, with every number tracing back to its elements, using the quantity takeoff template.
- Issue performance: track ACC issue status, aging, and root cause, with issues pinned to the model, using the ACC issues template.
- Clash resolution: turn Navisworks Clash Detective results into a coordination dashboard with status, assignment, and aging using the clash report.
- Model health: visualize Autodesk Model Checker results, family sizes, and performance against the Revit model with the model health template.
- Version comparison: pick a baseline and target version of an ACC model and get a focused change report with a 3D comparison using the version comparison template.
- Federated coordination models: report across a whole Model Coordination view with federated reports.
- Cost tracking: attach rates to model quantities and track cost as the design changes with the 5D cost template.
FAQ
Is Autodesk Construction Cloud now Autodesk Forma?
Autodesk has moved Autodesk Construction Cloud into the Autodesk Forma industry cloud. Many teams and search results still use the ACC name, so it is practical to search for both “Autodesk Forma” and “Autodesk Construction Cloud.”
Can Revit models from ACC be used in Power BI?
Yes. With Frame, teams can connect ACC-hosted Revit models, process the model data, and generate Power BI templates with assets, properties, versions, and 3D viewer context.
Can I report on federated Model Coordination views?
Yes. You can select an available federated Model Coordination view instead of a single Docs model. A federated view and one of its constituent models are different reporting scopes, so their element totals will not match.
Does connecting ACC bring every project dataset into Power BI?
No. Frame reports on models and, when synchronized, ACC issues. RFIs, submittals, project costs, and schedules need to be brought into a custom report separately.
Can Frame handle large Autodesk models?
Frame is designed around large BIM model reporting. Model processing happens before the Power BI template opens, and the report receives structured datasets instead of forcing Power BI to do every heavy transformation at open time.
Does Frame replace Autodesk Data Exchange?
No. Autodesk Data Exchange is useful for certain exchange workflows. Frame is focused on BIM reporting workflows where teams need Power BI templates, clean datasets, large-model support, and an interactive model viewer inside the report.
Next Steps
For the next step, use the construction dashboard tutorial to add explicit progress and cost records. Explore the dashboard gallery for model health, clashes, and other supported report examples, or create a Frame account to connect your first ACC model.