Autodesk Viewer in Power BI: Custom BIM Models Inside Reports
A practical workflow for using a custom Autodesk Viewer-based BIM viewer inside Power BI reports, with large-model support, saved views, colors, markers, and model-to-report interaction.

Frame Team

I have been looking at Autodesk Viewer search traffic because it says something useful about how BIM teams look for answers.
Most people do not start with “semantic model,” “property extraction,” or “dashboard template.” They start with a simpler question: can I open this model in the browser, click an element, and understand what I am looking at?
That is a good instinct. The viewer is often the first honest interface for BIM data.
The interesting part for us is what happens after the model is visible. A viewer by itself helps the team inspect geometry. A Power BI report helps the team compare quantities, statuses, packages, levels, issues, and cost codes. The useful workflow is putting both surfaces in the same review.
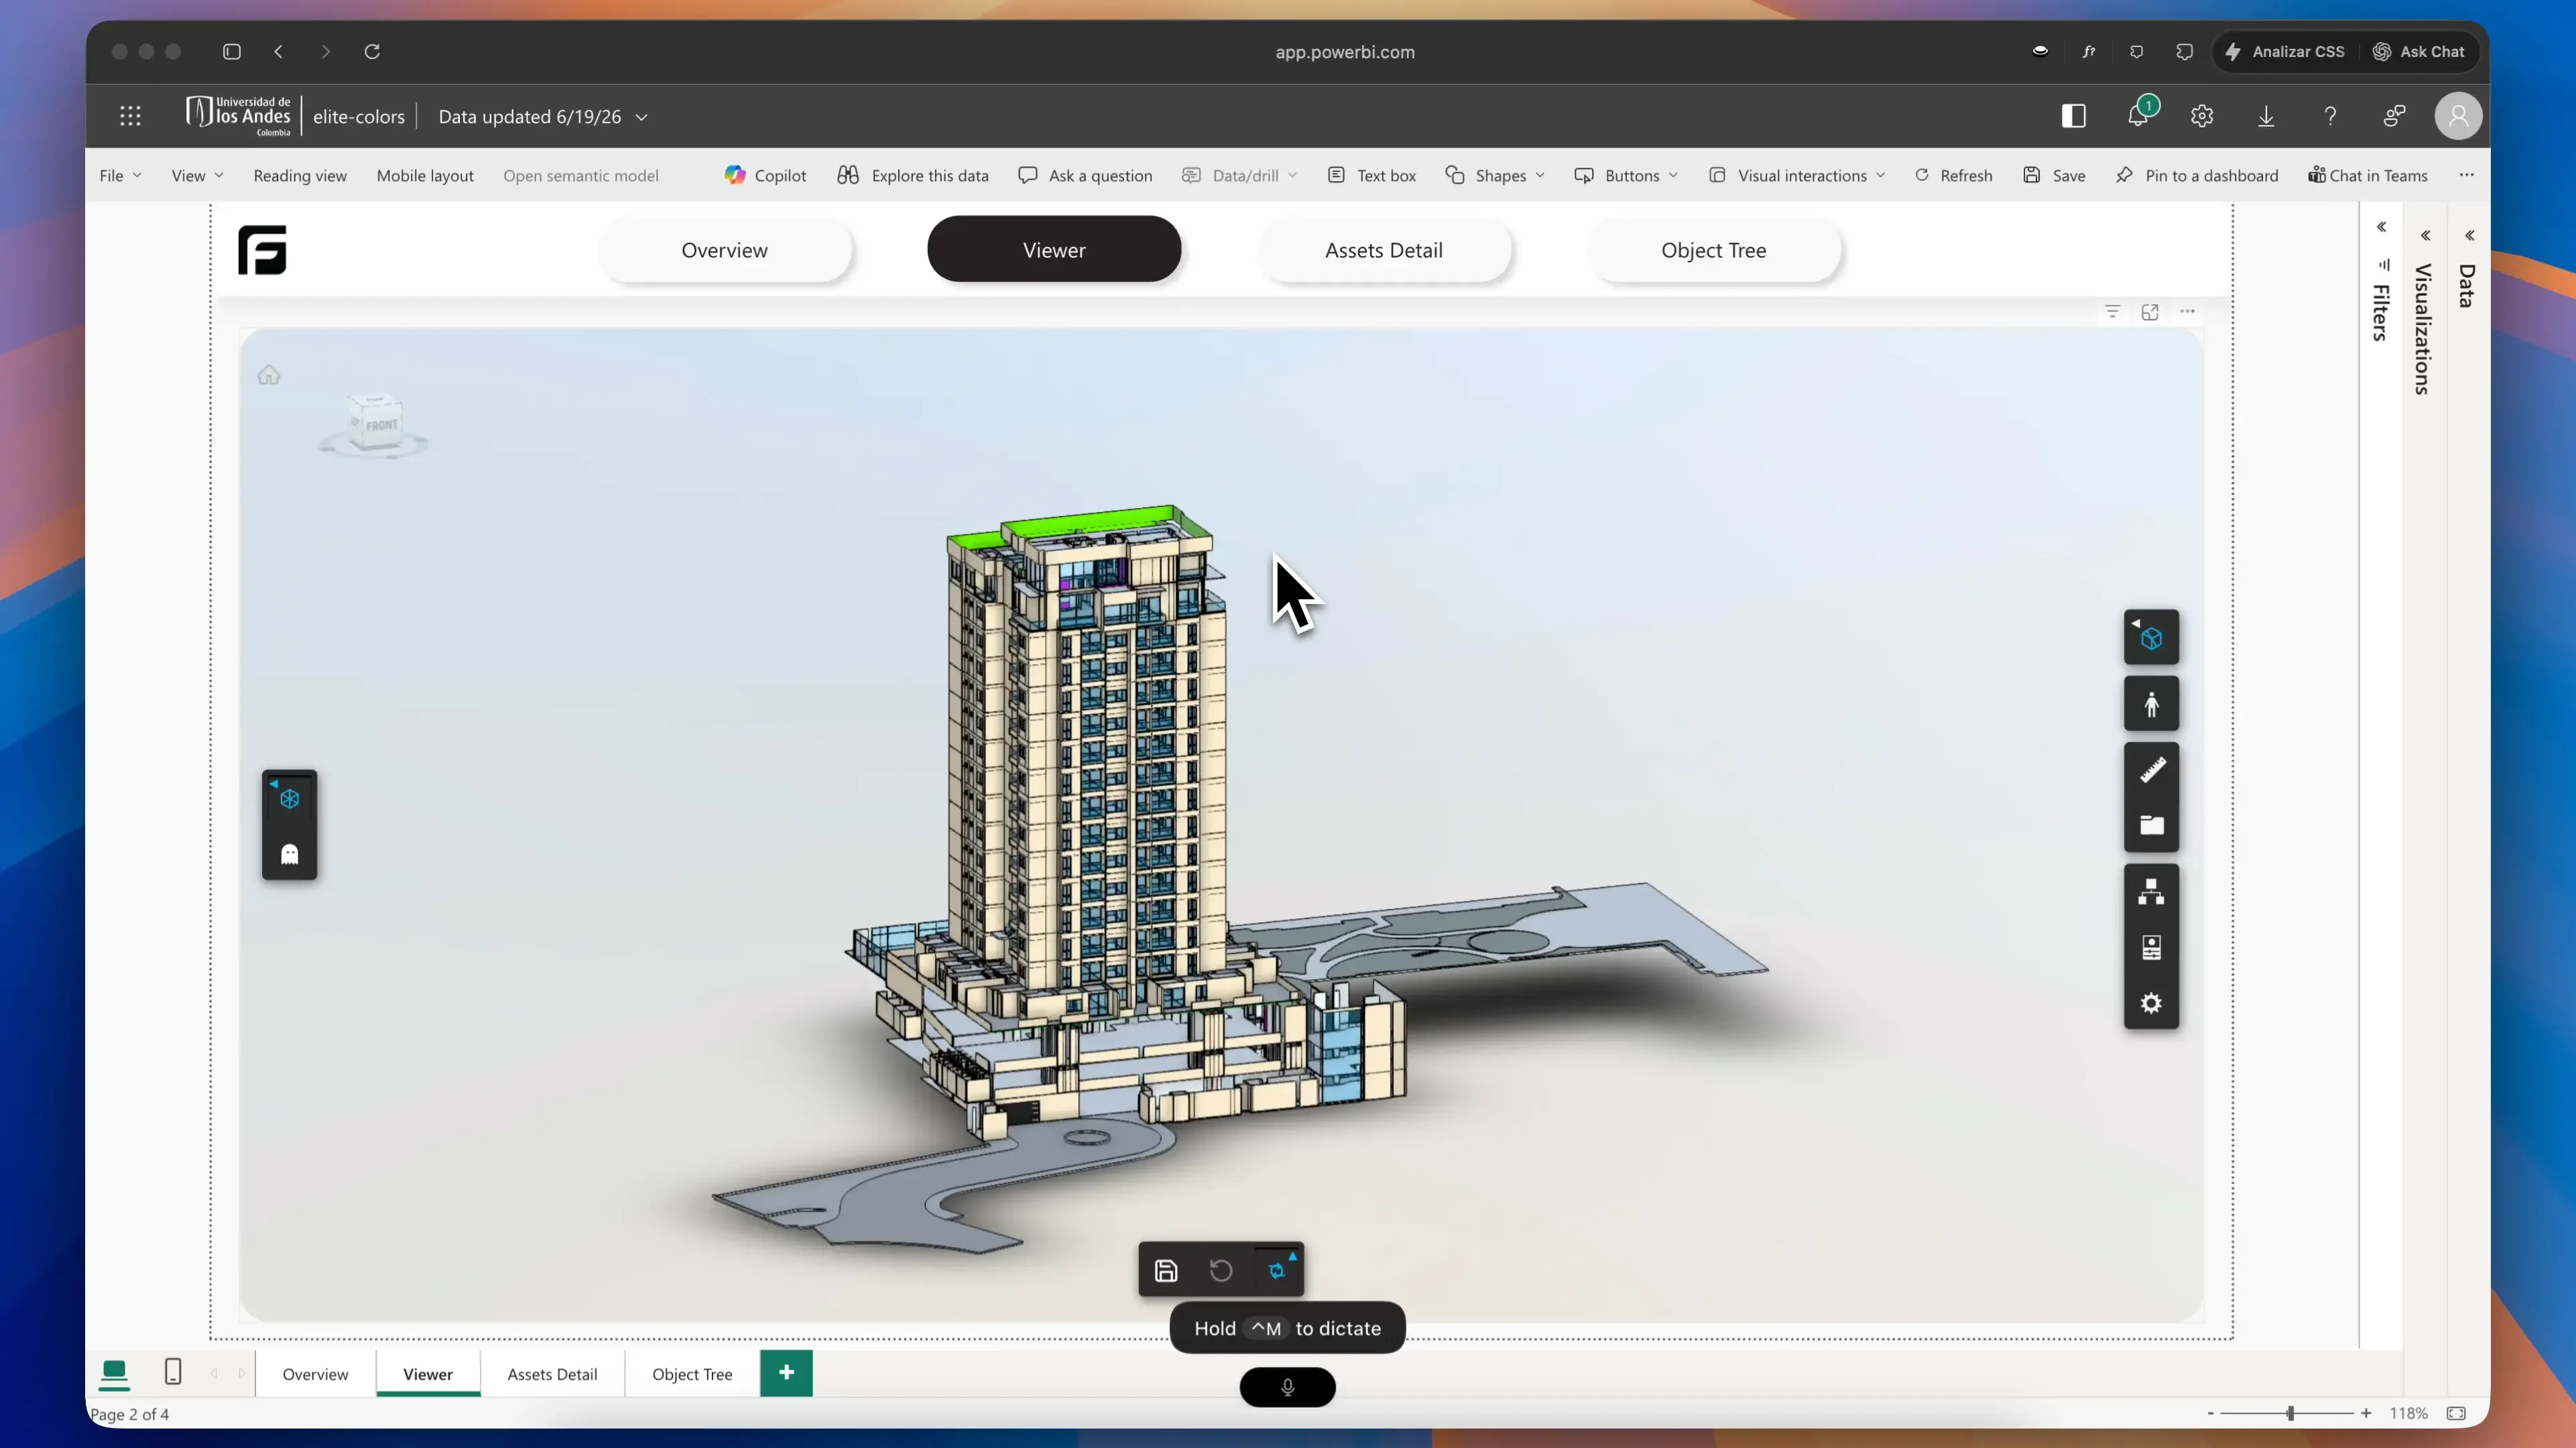
The custom viewer page keeps the model inside Power BI, with Frame viewer controls available where the report review happens.
The dataset side is built around clear Frame queries like FRAME_Assets and FRAME_Properties, so teams can extend the report without starting from raw model exports.
The Workflow We Want
The Power BI page I keep coming back to has three things on screen:
- A 3D viewer that can isolate or highlight model objects.
- Charts and tables built from model properties.
- A selected element panel that explains the object someone clicked.
That sounds simple, but it changes the meeting.
When the VDC lead clicks a wall type in a chart, the model should isolate those walls. When someone selects a pump in the viewer, the report should show the asset name, system, level, family, type, and any useful custom parameters. When a stakeholder asks why the count changed, the team should be able to move from the number to the objects without opening another tool.
The artifact is not just a screenshot of a model. It is a Power BI page where the model and the dataset keep each other honest.
This pairs closely with the newer Autodesk Forma to Power BI workflow, where the same viewer-and-dataset problem shows up through ACC/Forma project data.
The Autodesk Path
Autodesk has been moving in this direction too.
The Autodesk Data Connector for Power BI can load Data Exchange information into Power BI. Autodesk Platform Services also has open-source APS Power BI tools for working with design data and a viewer visual inside reports. Autodesk’s APS team has written about embedding the APS Viewer inside a Power BI report.
That gives teams a real path when they want to build their own pipeline:
- Create or access model data through Autodesk Platform Services or Data Exchange.
- Bring the model metadata into Power BI.
- Add a viewer visual.
- Wire report selections to viewer selections.
- Maintain the report as the model changes.
This is powerful, especially for teams with internal developers or BIM data specialists.
The part that usually takes longer than expected is the middle: getting the model properties into a shape that Power BI likes.
The Boring Data Shape Matters
For a Power BI BIM dashboard, the viewer is only half the job.
The report needs tables that can survive real project data:
Elements: one row per model object with stable identifiers.Properties: parameter names, values, groups, and units.Hierarchy: category, family, type, level, model, and source file context.Versions: enough metadata to compare one model publish against another.IssuesorClashes: when the report is about coordination rather than quantity takeoff.
If those tables are messy, the viewer becomes a nice visual panel beside a fragile report. The dashboard works for the demo model and then falls apart on the project model with inconsistent family names, missing levels, duplicate types, or different parameter conventions.
This is where Frame spends a lot of time. The visible part is the viewer in the report. The less visible part is normalizing Revit, IFC, Navisworks, and ACC model data into tables that Power BI can query without a week of manual cleanup.
The Dataset Should Be Clear Enough To Reuse
One design decision we care about a lot is the dataset we give to the report.
Frame does not ask the Power BI user to start from a raw model export and figure out the reporting shape alone. We generate a custom dataset for the report, and we try to keep the core queries as clear as possible.
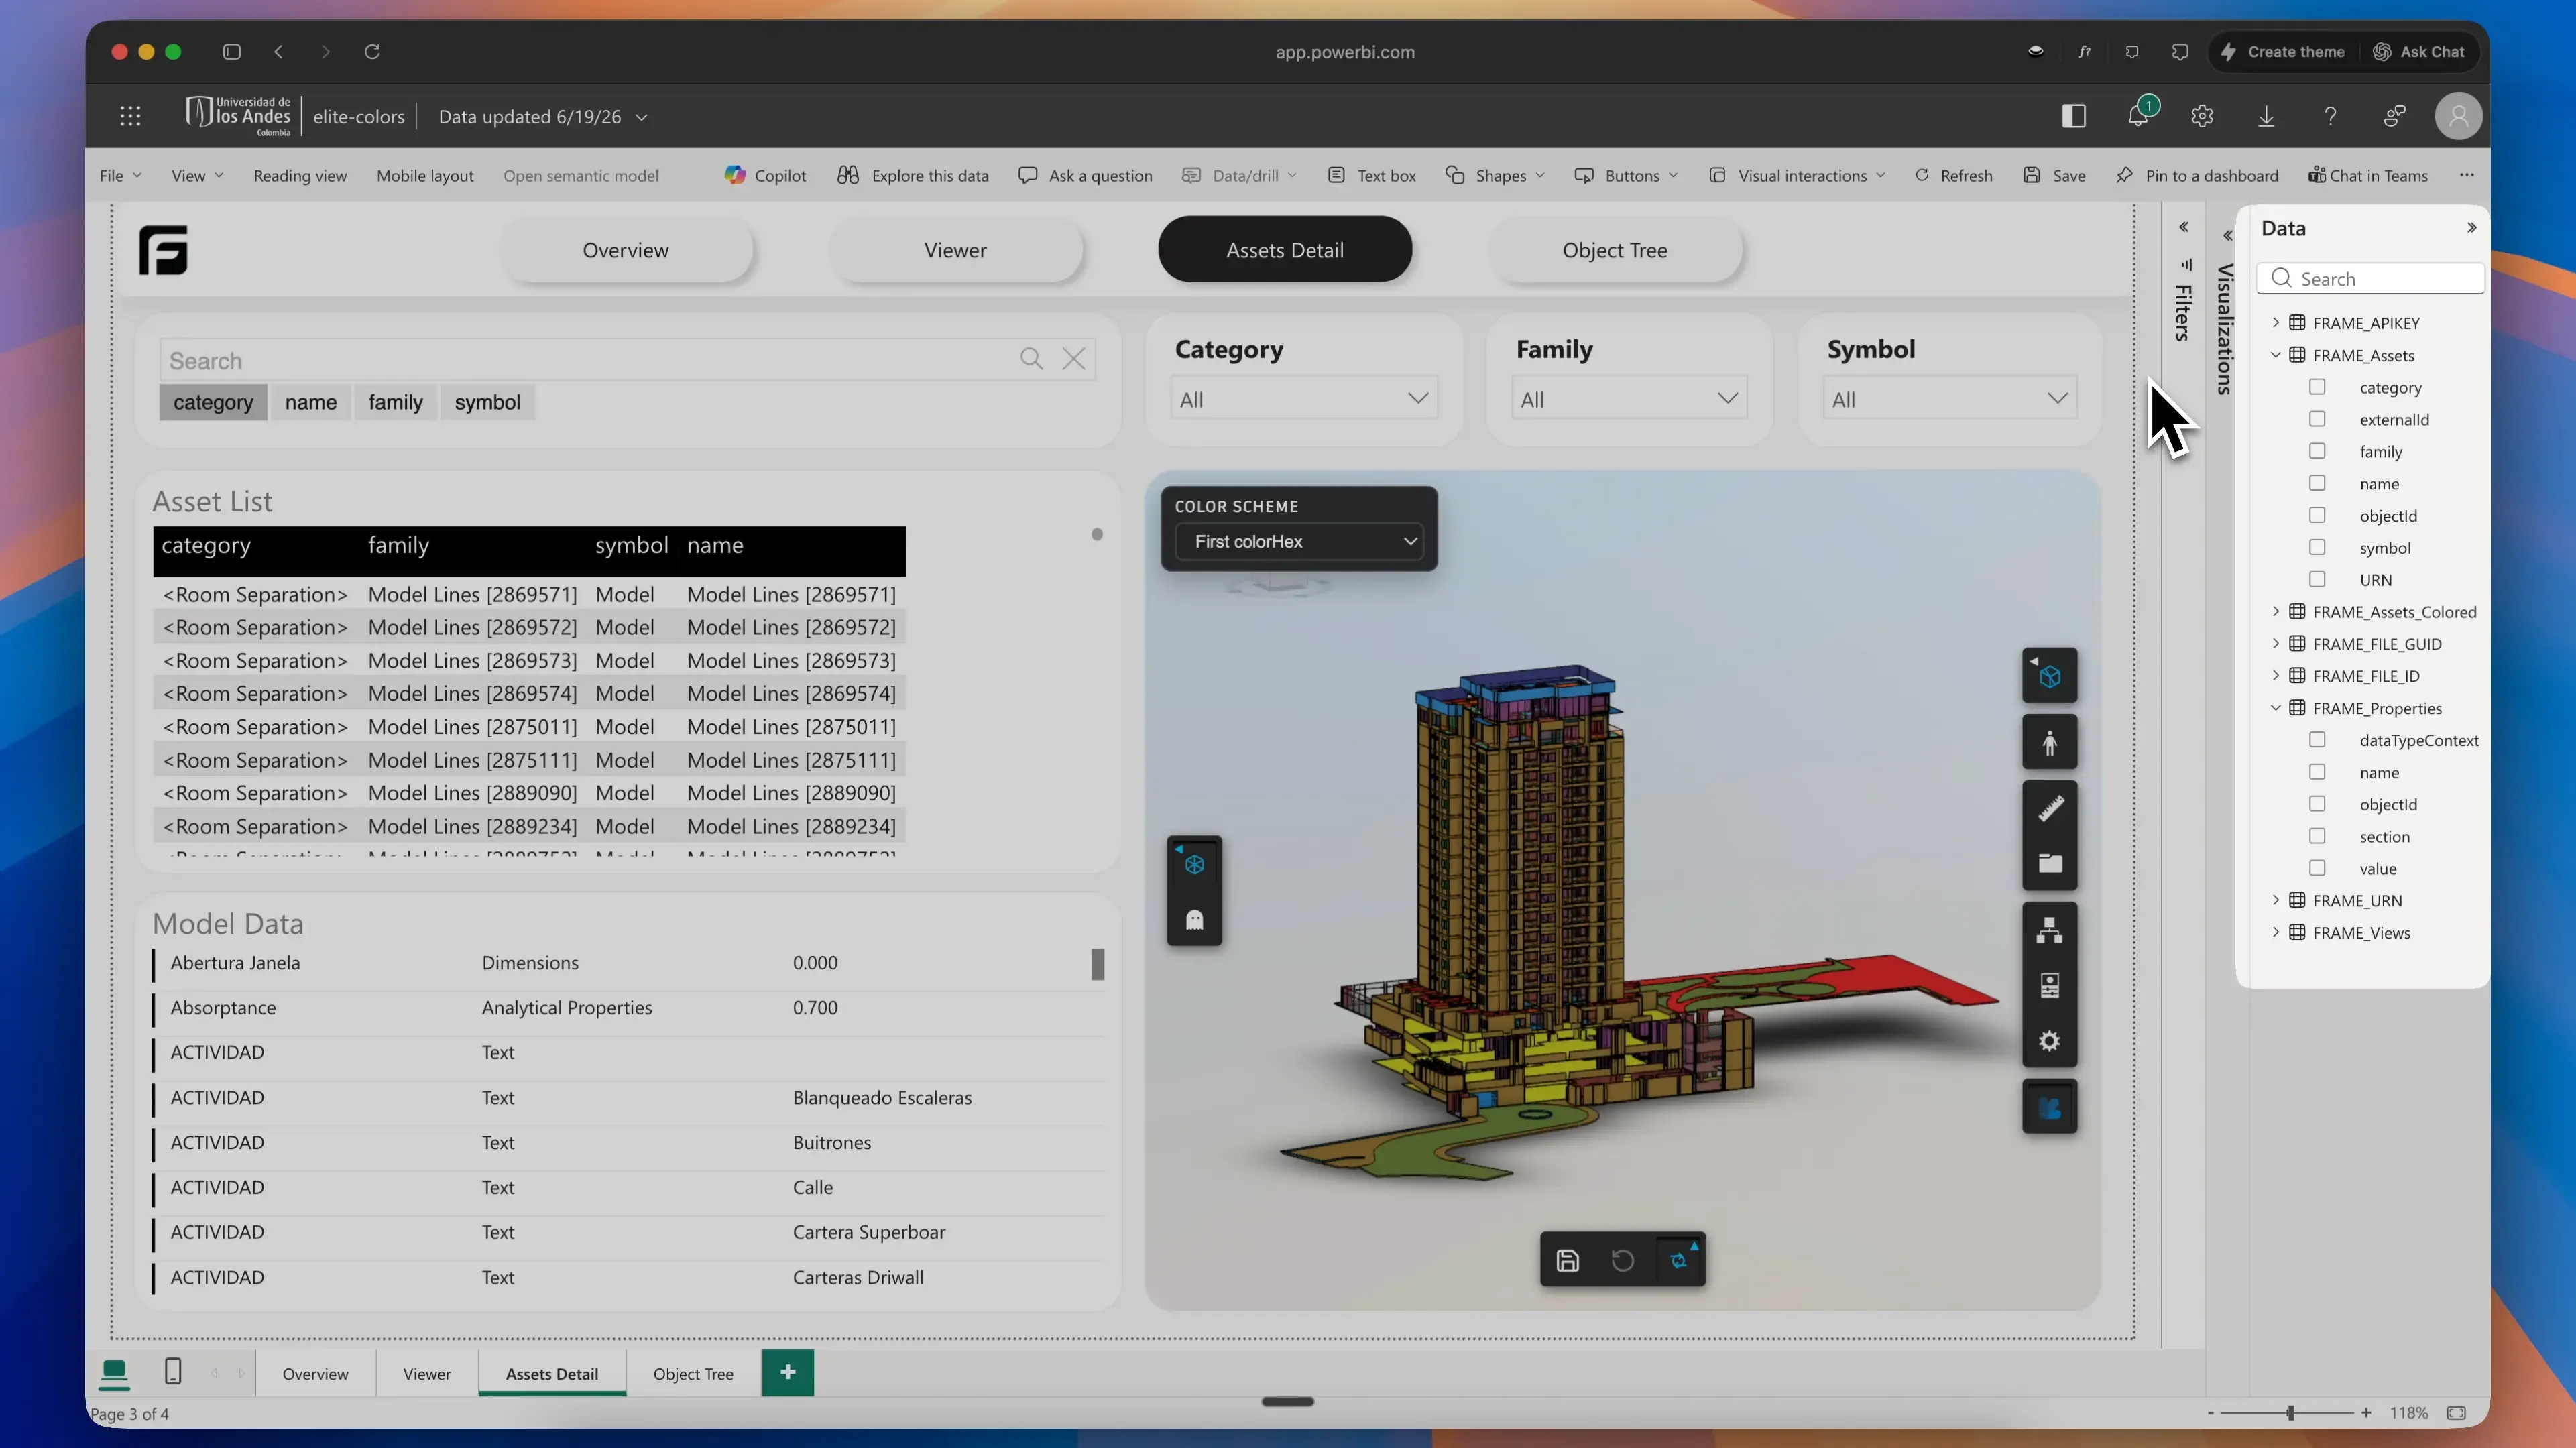
The two queries most teams start from are:
Assets: the model objects in a reporting-friendly shapeProperties: the detailed property values linked back to those assets
From there, the Power BI author can duplicate those queries and create their own custom datasets: assets by level, equipment by system, doors missing fire ratings, rooms by department, or whatever the report needs.
That has been clearer for us than the usual Autodesk Data Exchange flow, where the data can be useful but the report author still has to spend a lot of time understanding the shape before building the dashboard. In Frame, the starting point is already organized around BIM reporting.
It also helps with big models. The report does not have to reshape the whole model from scratch every time. Frame does the heavy model processing before the template opens, then Power BI receives queries that are smaller, clearer, and easier to extend.
What Frame Does Differently
In Frame, the workflow starts from the model rather than from a blank Power BI file.
A BIM lead can add a Revit, IFC, or Navisworks model from local upload or Autodesk Construction Cloud. Frame processes the model, extracts the object tree and properties, and prepares report-ready datasets. From there, the team can open a Power BI template that already understands the model structure.
The viewer is connected to the report instead of sitting beside it as a static preview.
Useful interactions include:
- selecting an element in the viewer and seeing its Power BI row context
- filtering categories, levels, families, or systems from report visuals
- using the viewer to validate a quantity or model health metric
- saving views that make sense for review meetings
- connecting the same processed model to Excel or other Frame workflows
This is the practical difference between “I can see the model” and “I can use the model as a report surface.”
The Custom Viewer Is The Product Surface
Frame’s viewer is based on Autodesk Viewer technology, but the product surface is not a plain embedded viewer.
We have built custom viewer extensions around the review habits BIM teams actually repeat:
- applying colors to elements from dashboard data
- saving color states for recurring reviews
- adding markers for issues, clashes, assets, or review notes
- saving camera views that can be reopened later
- saving isolated element sets instead of rebuilding the same filter every week
- moving selection both ways between the viewer and Power BI visuals
That last point matters. The report should not only filter the model. The model should also filter the report.
If someone clicks an element in the viewer, the outside visuals should respond. If someone clicks a chart segment, the viewer should isolate or color the related objects. If the team spends twenty minutes building a useful view, they should be able to save that state and bring it back in the next meeting.
Those are small product details, but they are the details that make a model viewer usable inside a reporting workflow.
Big Models Change The Architecture
The other lesson from building BIM dashboards is that model size changes almost everything.
A workflow can look fine on a clean sample model and still fail on a real project: federated ACC models, large Revit files, IFC exports, or Navisworks coordination files with many source models. We have seen this especially when comparing model-centered Frame workflows with Autodesk Data Exchange-style paths. Data Exchange is useful, but large model reporting can hit practical limits before the dashboard gets to the review meeting.
Frame has been architected around the larger-model case:
- process model data before it reaches the report
- prepare Power BI-friendly tables instead of pushing raw model shape into the template
- give the report clear
AssetsandPropertiesqueries that can be duplicated into custom datasets - keep viewer identifiers aligned with report rows
- avoid making Power BI do work that should happen server-side first
- make saved viewer states small enough to reuse across sessions
- keep interaction responsive when the model and the report both have a lot of data
This deserves its own architecture post because the details matter. The short version is that big BIM models cannot be treated like small demo datasets with more rows. The report generation pipeline, the artifact format, and the Power BI viewer all have to be designed around that constraint.
A Good First Power BI Page
If you are trying this for the first time, I would not start with a complex executive dashboard.
Start with a model inspection page:
- total elements by category
- elements by level
- family and type breakdown
- a searchable element table
- selected element details
- a large viewer panel
Then test the report with a real question from coordination or estimating:
- “Which wall types are on Level 03?”
- “Why did mechanical equipment count change between versions?”
- “Which elements are missing classification parameters?”
- “Can we isolate all doors without fire rating data?”
Those questions reveal whether the dataset and viewer are actually connected.
Where This Fits
Autodesk Viewer is still a good mental model for what people want first: open the model, inspect it, and share it. Power BI adds a second need: make the model measurable, repeatable, and useful in project reporting.
I think the best BIM dashboards start when those two needs are designed together.
The viewer gives the number spatial context. The report gives the model an analysis layer. The team gets one artifact they can use in a review instead of a viewer link, a spreadsheet, and a separate dashboard that all have to be explained by hand.
Related Frame posts:
- Autodesk Forma to Power BI: Dashboards for ACC Model Data
- Frame’s Custom Viewer for Power BI: Interactive 3D BIM Analytics
- BIM Power BI Dashboard Templates for Revit, IFC, ACC, and Navisworks
- Autodesk Viewer: The Underrated Free 3D Online Tool You Should Be Using
- Power BI Dashboards from Local Revit Files Without ACC