Power BI Starter Template for BIM Models from Frame
Create professional Power BI dashboards for Revit, IFC, and Navisworks models in minutes. Pre-built visualizations and clean datasets.

Frame Team
Introduction
Power BI has become one of the most important tools in the analytics world. It’s now used from small projects to big companies on a daily basis. The reason is understandable—the tool allows users to connect the simplest source of data, such as a simple spreadsheet, to more complex integrations like Web APIs, third-party integrations, databases, and more.
When we want to integrate this kind of tool into construction workflows, big companies usually don’t have trouble with it. They have specialized people or can outsource the resources to create their analytics. But when a small to mid-sized firm wants to enter this world, it’s fundamental that we, as construction tech providers, deliver the best user experience with the least friction possible. We know the construction industry is one of the most resistant to change, which makes ease of use critical.
That’s what we’ll talk about today: Power BI templates and how Frame’s starter templates remove the technical barriers that have traditionally kept BIM data separate from business intelligence. Whether you’re looking for a Power BI dashboard example, searching for ready-to-use Power BI templates, or wanting to understand Power BI design best practices for construction, this guide will show you how to get started with professional BIM analytics in minutes.
Can You Create a Power BI Template?
Before diving into how to use Power BI templates for BIM analytics, let’s clarify what a Power BI template actually is and whether you can create one yourself.
What is a Power BI Template?
A Power BI template (.pbit file) is a reusable dashboard blueprint that
contains all the visual elements, data relationships, calculations, and design
formatting—but without the actual data. Think of it as a framework or starting
point that you can apply to different datasets with the same structure.
Power BI templates include:
- Pre-built visualizations: Charts, tables, graphs, and custom visuals already configured
- Data model structure: Table relationships, primary/foreign keys, and data hierarchies
- DAX measures and calculated columns: Business logic and calculations already written
- Design theme and formatting: Consistent branding, colors, fonts, and layout
- Slicers and filters: Interactive controls for data exploration
Can You Create Your Own Power BI Template?
Yes, absolutely! Anyone with Power BI Desktop can create templates. The process is straightforward:
- Build your Power BI report with all desired visualizations and data connections
- Configure your data model with relationships, measures, and calculations
- Save as template: File → Export → Power BI Template (.pbit)
- Share the .pbit file with others who can open it and connect their own data
However, creating a professional, production-ready template requires significant expertise:
- Data modeling best practices: Understanding star schemas, normalization, and performance optimization
- DAX proficiency: Writing efficient measures and calculated columns for complex business logic
- UX/UI design skills: Creating intuitive, visually appealing dashboards that tell a clear story
- Domain expertise: Understanding BIM data structures, construction workflows, and industry-specific analytics needs
For BIM professionals specifically, creating templates involves additional complexity:
- Understanding different file formats (Revit, IFC, Navisworks) and their unique data structures
- Handling hierarchical object trees and parent-child relationships
- Managing property data across different categorization systems
- Dealing with large datasets efficiently (models can have hundreds of thousands of elements)
This is where Frame’s Power BI starter templates come in—we’ve done the heavy lifting so you don’t have to.
How to Use Power BI for BIM
Power BI for BIM is especially useful for driving BIM development and technology adoption within projects. It’s an essential tool if you want to put to work the rich data your models contain and connect it with other data sources to take full advantage of it—whether that’s for economic and time savings or for better decision-making.
Why Power BI Matters for BIM Workflows
Traditional BIM workflows keep data locked inside specialized software like Revit, Navisworks, or IFC viewers. While these tools are excellent for design and coordination, they’re not built for business intelligence or executive reporting. Power BI bridges this gap by:
- Democratizing BIM data: Making model information accessible to non-technical stakeholders who don’t use CAD software
- Enabling portfolio analytics: Aggregating data from multiple projects for enterprise-wide insights
- Connecting disparate data sources: Combining BIM properties with cost databases, schedules, procurement systems, and more
- Providing real-time insights: Creating live dashboards that update as models evolve throughout the project lifecycle
- Supporting data-driven decisions: Transforming technical properties into actionable business metrics
Common BIM Analytics Use Cases in Power BI
Here are real-world scenarios where Power BI transforms how construction teams work with BIM data:
- Quantity Takeoff Dashboards: Track material quantities across design iterations, compare planned vs. actual quantities, and monitor changes over time to catch scope creep early.
- Clash Detection Analytics: Visualize Navisworks clash results by discipline and severity, track resolution rates, and identify coordination bottlenecks.
- Design Progress Tracking: Monitor model completeness by tracking LOD (Level of Development) properties and compare progress across building zones.
- Cost-Loaded Schedules: Combine BIM element properties with cost data to create 5D visualizations linking quantities, schedules, and budgets.
- Asset Management: Prepare facility management handover data, create maintenance schedules, and generate asset inventories for operations teams.
How to Apply a Power BI Template
Applying a Power BI template is remarkably simple—especially when compared to building a dashboard from scratch. Here’s how the process works:
Standard Power BI Template Process
- Download or receive the .pbit template file
- Open Power BI Desktop (free download from Microsoft)
- Double-click the .pbit file to open it in Power BI Desktop
- Enter connection parameters when prompted (this varies by template)
- Authenticate to your data source if required
- Wait for data to load—the template automatically populates all visualizations
- Explore your dashboard—all charts, tables, and visuals are ready to use
Frame’s Power BI Templates
Frame offers multiple specialized Power BI templates tailored to different BIM analytics needs, including:
- Starter Template: Perfect foundation for users new to Power BI or wanting to customize their own dashboards (the focus of this guide)
- Quantity Takeoff Template: Material quantity tracking and cost estimation
- Clash Report Template: Navisworks clash detection analysis and resolution tracking
- Issues Template: ACC issues management with workload and performance metrics
- File Versioning Template: Track model changes and revisions over time
For a comprehensive overview of all Frame’s templates and their capabilities, see our Complete Guide to Autodesk and Revit Power BI Templates
All Frame templates come pre-configured with the data connections already set up. When you open a Frame template:
- Open the downloaded .pbit file from your Frame dashboard
- Authenticate with Frame (credentials are requested once)
- Data loads automatically—Frame handles all the data extraction and formatting
- Start exploring immediately—no data cleanup or transformation required
This streamlined process means you can go from raw BIM model to professional analytics dashboard in minutes, not hours or days.
Power BI Starter Template by Frame for BIM Models
Let’s dive deep into Frame’s Starter Template—our most popular template and the perfect foundation for BIM analytics beginners and advanced users alike.
Template Variants by File Type
Frame provides a specific Starter Template for each major BIM file format:
- Revit Starter Template (.rvt files)
- IFC Starter Template (.ifc files)
- Navisworks Starter Template (.nwd, .nwf, .nwc files)
Each variant handles data formatting specific to that file type, but all maintain a visually similar and consistent experience. The differences primarily relate to how we process and structure the hierarchical data:
- Revit: Category → Family → Symbol hierarchy with Revit-specific parameters
- IFC: IfcType and IfcBuildingStorey classification structures
- Navisworks: Source file tracking with aggregated category/family/symbol from composite models
Dataset Structure
When you open the Starter Template, you’ll find a clean, well-organized dataset with these primary tables:
FRAME_Assets (Elements Table)
- Contains all model elements/objects with their core properties
- Key columns: Element ID, Name, Category, Family, Type/Symbol, Level, Volume, Area
- Pre-filtered to exclude irrelevant system families and metadata objects
- Optimized for performance even with large models (100k+ elements)
FRAME_Properties (Properties Table)
- Detailed property values organized by property category
- Key columns: Element ID, Property Category, Property Name, Value, Data Type, Units
- Normalized structure allows flexible filtering and analysis
- Includes both instance and type parameters
All relationships between these tables are pre-configured with proper primary/foreign keys, following Power BI data modeling best practices. This means you can immediately start creating new visualizations without worrying about relationship errors or data integrity issues.
Dashboard Layout and Pages
The Starter Template includes four carefully designed pages, each serving a specific analytical purpose:
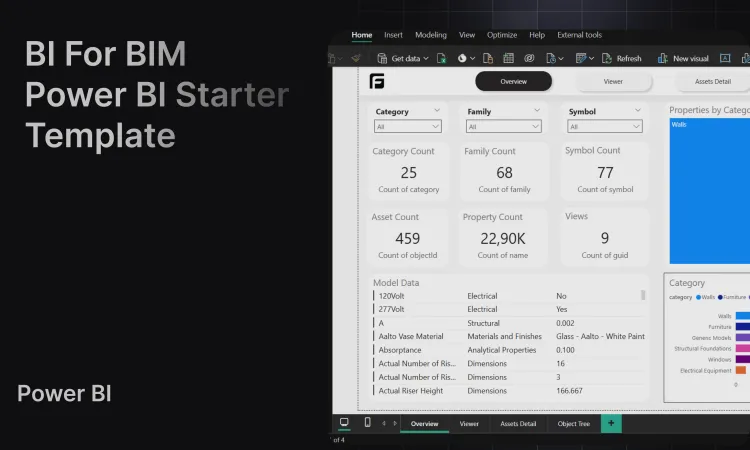
Page 1: Overview
The Overview page provides high-level project statistics and element distribution:
-
Key Metrics Cards:
- Total element count
- Number of unique categories
- Number of unique families
- Model volume (cubic meters/feet)
-
Category Distribution Chart: Horizontal bar chart showing element counts by category, making it easy to identify which systems dominate the model
-
Family Distribution Chart: Treemap or clustered bar chart showing the most common families
-
Level Distribution Chart: Element counts by building level/floor for spatial analysis
-
Filter Panel: Slicers for Category, Family, and Level to interactively explore the data
This page is perfect for executive summaries and initial model reviews, giving stakeholders immediate insight into model composition without technical BIM knowledge.
Page 2: 3D Viewer (Full Page)
A dedicated full-screen page featuring the Frame 3D Viewer—a powerful, interactive model visualization tool integrated directly into your Power BI report.
Unlike the basic Autodesk viewer included with other connectors, Frame’s viewer offers:
- Saved custom views: Bookmark specific camera positions and element selections
- Advanced element isolation: Click to isolate elements from dashboard selections
- Multiple color-coding schemes: Apply visual styles based on any property (category, status, phase, etc.)
- 2D sheet visualization: View drawing sheets alongside the 3D model
- Bi-directional filtering: Select elements in the viewer to filter dashboard data, or vice versa
This page transforms your Power BI report from a static dashboard into an interactive BIM exploration tool.
Page 3: Assets (Elements Table)
The Assets page is the workhorse of the template, providing detailed element-level data:
-
Elements Table: Comprehensive table showing all model elements with key properties (Name, Category, Family, Type, Level, Volume, Area)
- Sortable columns for easy data exploration
- Search/filter capabilities
- Export to Excel functionality built-in
-
Properties Panel: Detailed property viewer showing all parameters for selected elements
- Organized by property category
- Displays units and data types
- Filterable by property name
-
Interactive Slicers:
- Category dropdown
- Family dropdown
- Level/Floor dropdown
- Custom property filters
-
Frame 3D Viewer (Embedded): Smaller viewer synchronized with table selections—click a row to highlight the element in 3D
This page is essential for detailed analysis, quantity takeoffs, and property validation. Users can quickly find specific elements, inspect their properties, and verify data quality.
Page 4: Object Tree
The Object Tree page visualizes model hierarchy and relationships:
-
Hierarchy Visualization: Decomposition tree or matrix visual showing the model structure
- Drill down from building → level → category → family → element
- Interactive expansion/collapse functionality
- Element count aggregations at each level
-
Sunburst or Treemap Chart: Alternative hierarchical visualization showing proportional element distribution
-
Slicers: Filter the tree by category, level, or other criteria
-
Frame 3D Viewer (Embedded): Synchronized with hierarchy selections for spatial context
This page helps users understand model organization, identify structural patterns, and navigate complex models more intuitively than traditional element lists.
How Data Loads in the Template
One of Frame’s key innovations is our secure, high-performance data delivery approach:
| Step | Process | Description |
|---|---|---|
| 1 | Model Processing | Upload or sync BIM files from ACC; Frame extracts and transforms element data and properties |
| 2 | CSV Generation | Frame creates optimized CSV files with structured datasets (Assets, Properties, Hierarchy) |
| 3 | Secure Storage | CSV files are encrypted and stored with authentication-controlled access |
| 4 | Template Connection | Power BI templates come pre-configured with data connections to your model’s CSV files |
| 5 | Authentication | One-time Frame credential setup when opening the template |
| 6 | Data Refresh | Power BI downloads CSV data and auto-populates visualizations; refreshes pull latest data |
Critical Benefits:
- Security – Data remains encrypted with token-based access control
- Performance – Optimized CSV ingestion loads 100k+ element models in seconds (faster than API/database connections)
- Reliability – Stable data source unaffected by network issues or rate limits
- Flexibility – CSV files work offline and integrate with Excel, Tableau, or custom scripts
- Automatic Updates – CSV files refresh automatically when new model versions are detected in your CDE
Benefits of the Starter Template
| Benefit | Key Features |
|---|---|
| Immediate Value | Launch professional BIM analytics in minutes, not weeks • No data modeling or DAX expertise required • Pre-built visualizations demonstrate best practices |
| Clean, Production-Ready Data | Frame handles all data transformation • Proper data types and units auto-detected • Optimized for large datasets • Follows Power BI best practices |
| Foundation for Growth | Designed as a starting point for customization • Easy to extend with new visualizations • Clear structure for adding tables • Well-documented for learning |
| Cross-Platform Compatibility | Works with Revit, IFC, and Navisworks models • Consistent experience across file types • Easily compare data from different authoring tools |
| Cost-Effective | Free Power BI Desktop app (no license required) • No expensive custom development • Eliminates need for specialized BI consultants |
| Professional Presentation | Modern, clean design suitable for client presentations • Executive-friendly visualizations • Interactive 3D viewer impresses stakeholders |
Personalization and Customization
While the Starter Template provides immediate value out of the box, its true power lies in how easily you can customize it to match your specific needs. We designed it specifically with extensibility in mind.
Why the Starter Template is Perfect for Customization
The Starter Template is intentionally designed to be approachable for users with varying Power BI skill levels:
- Clear data structure: Well-organized tables with intuitive naming
- Proper relationships: Pre-configured foreign keys make adding new visuals straightforward
- Clean dataset: No messy data cleanup required before extending
- Best practices: Follow our template structure to learn Power BI design patterns
- Documentation: Field names and measures are clearly labeled
Whether you’re a Power BI beginner or an advanced user, you’ll find the Starter Template easy to work with.
Connecting Other Data Sources
One of Power BI’s greatest strengths is combining data from multiple sources. Here’s how to enhance your BIM analytics by connecting additional data:
| Data Source | Use Cases |
|---|---|
| Cost Databases | Join cost-per-unit data to BIM elements by category/family/type; create cost-loaded visualizations and budget tracking dashboards |
| Project Schedules | Connect to P6, MS Project, or spreadsheets; link elements to activities for 4D visualizations and schedule variance tracking |
| Procurement Systems | Compare ordered quantities against BIM quantities; identify procurement gaps, over-ordering, and track delivery status |
| ERP Systems | Link SAP/Oracle financial data to BIM quantities; analyze cost variance and generate financial reports tied to physical model data |
| External Databases | Direct query SQL Server/PostgreSQL for real-time connections; store historical model versions for trend analysis |
| Web APIs | Connect to REST APIs for live data feeds; pull weather data, material pricing indexes, or other external metrics for enriched analytics |
To add a new data source:
- In Power BI Desktop, click Home → Get Data
- Select your data source type (Excel, SQL Server, Web, etc.)
- Configure connection and authenticate
- Load the data into your model
- Create relationships to existing Frame tables (usually by matching on Element ID, Category, Family, or custom properties)
Creating New Queries and Data Transformations
Power BI’s Power Query Editor allows you to transform and shape data before loading it into your report. Here are common customization scenarios:
Filtered Views
- Create filtered copies of the Assets table (e.g., “Structural Elements Only” or “MEP Systems”)
- Improves report performance by reducing data volume
- Enables specialized dashboards for specific disciplines
Calculated Columns
- Add custom columns based on business logic
- Example: Create a “Size Category” column that classifies elements as Small/Medium/Large based on volume
- Example: Extract floor number from Level name (e.g., “Level 1” → 1)
Aggregated Tables
- Pre-aggregate element counts by category and level
- Speeds up visualizations that don’t need element-level detail
- Useful for high-level executive dashboards
Custom Hierarchies
- Create drill-down paths tailored to your organization (e.g., Building → Zone → System → Category → Element)
- Makes navigation more intuitive for your specific workflows
Data Quality Checks
- Add columns flagging missing or invalid data
- Create “Data Quality” pages showing elements with incomplete properties
- Ensure model standards compliance
To create a new query:
- Click Home → Transform Data to open Power Query Editor
- Select an existing table and click Reference or Duplicate to create a new query based on it
- Apply transformations using the ribbon tools or M code
- Click Close & Apply to load the new query into your model
Creating New Visualizations
Power BI offers hundreds of visualization types—both built-in and custom. Here’s how to extend the Starter Template:
Adding New Chart Types
- Scatter plots: Visualize relationships between two numeric properties (e.g., volume vs. cost)
- Waterfall charts: Show cumulative quantity changes across design versions
- Gauge charts: Display progress toward quantity targets
- Maps: If your model includes geospatial data, plot elements on geographic maps
- Custom visuals: Import community-built visuals from the AppSource marketplace (Gantt charts, Sankey diagrams, etc.)
Creating New Pages
- Duplicate an existing page as a starting point
- Create discipline-specific pages (Architecture, Structural, MEP)
- Build client-facing vs. internal team views
- Design mobile-optimized pages for field access
Best Practices for Customization
When customizing your template, start small by making incremental changes rather than rebuilding everything at once—test each modification before adding complexity and save versions as you go (File → Save As). Follow consistent naming conventions by prefixing custom queries with your organization name or “Custom_”, using clear, descriptive measure names (e.g., “Total Structural Steel Volume (m³)”), and staying aligned with Frame’s conventions for clarity. Optimize for performance by removing unnecessary columns in Power Query, pre-aggregating data where possible instead of calculating on every visualization, and using DirectQuery sparingly since imported data performs better for most BIM use cases.
Document your changes thoroughly by adding comments to DAX measures explaining business logic, creating a “Documentation” page listing customizations, and tracking which data sources you’ve connected. Finally, leverage Frame support—our documentation includes Power BI customization guides, our support team can troubleshoot relationship issues or DAX errors, and you can share your customizations with the Frame community for feedback.
Summary
Power BI templates revolutionize how construction professionals access BIM analytics by eliminating the technical barriers that traditionally kept model data siloed in specialized software. Frame’s Starter Template takes this a step further by providing not just a dashboard blueprint, but a complete analytics solution with clean data, professional visualizations, and an intuitive user experience.
Here’s what makes Frame’s Power BI Starter Template unique:
- Instant value: Professional BIM analytics dashboard in minutes, not weeks
- Clean datasets: Pre-transformed, optimized data ready for analysis—no cleanup required
- File type flexibility: Dedicated templates for Revit, IFC, and Navisworks models
- Advanced 3D viewer: Frame’s custom viewer integrated directly into Power BI with features the standard Autodesk viewer lacks
- Designed for customization: Perfect foundation for extending with your own visualizations, data sources, and business logic
- Secure and performant: CSV-based data delivery provides encryption, speed, and reliability
Whether you’re creating your first Power BI dashboard or you’re an experienced analyst looking for a solid starting point, Frame’s Starter Template provides the professional Power BI dashboard example you need to accelerate your BIM analytics journey.
Conclusion
The construction industry’s digital transformation depends on making BIM data accessible and actionable for everyone—from project managers and estimators to executives and clients. Power BI is the perfect bridge between technical BIM models and business intelligence, but building production-ready dashboards requires expertise most firms don’t have in-house.
Frame’s Power BI Starter Template eliminates this barrier entirely. You get a professionally designed Power BI template that demonstrates industry best practices, handles the complex data transformations automatically, and provides immediate analytical value. More importantly, you get a foundation you can build upon—connecting additional data sources, creating custom visualizations, and tailoring the analytics to your specific workflows.
Whether you’re tracking quantities, analyzing costs, monitoring design progress, or reporting to stakeholders, Frame’s Starter Template gives you the power bi design and structure you need to succeed. And because it’s built on clean, well-organized data following Power BI best practices, you can customize it confidently as your analytics needs evolve.
Ready to transform your BIM models into powerful Power BI dashboards? Get started with Frame today and download your first Starter Template in minutes.
For more information on connecting Autodesk Construction Cloud to Power BI, check out our ACC Power BI Integration Guide. To explore other Frame features and integrations, visit our Power BI Features Overview.