Getting Started with Frame's Power BI Integration
Connect your BIM model to Power BI and create interactive reports with Frame's templates.

Frame Team

We see a lot of construction data locked inside complex models. Frame’s Power BI integration brings that data to life—so everyone can use it, not just the tech teams.
Here’s what you can achieve with Frame’s Power BI integration - an interactive dashboard that brings your BIM data to life using our starter template (base):
If you’ve just uploaded your first model to Frame, let’s walk through how to create your own interactive dashboard like the one above.
What makes this integration stand out?
-
Live, interactive 3D models: Embed your Autodesk or IFC models right into Power BI reports. Click on charts to filter the 3D view, or select elements in the model to filter data visualizations.
-
Automated templates: Frame processes your model and hands you a ready-made Power BI starter template (.pbit file), packed with construction-specific visuals.
-
Real-time analysis: The connection is two-way. Changes in your data show up instantly in your dashboards.
From model to report: A step-by-step guide
Configure Autodesk Credentials
Link your Frame account with Autodesk Platform Services (APS) to enable model translation tasks. This one-time configuration grants Frame the authorization to process your models.
Need help? See our guide: Setting Up Your Autodesk Integration with Frame.
1. Upload and process your model
Start in your Frame dashboard. Upload your model, and Frame’s analytics engine extracts and organizes all the data—object properties, classifications, materials—so it’s ready for analysis.
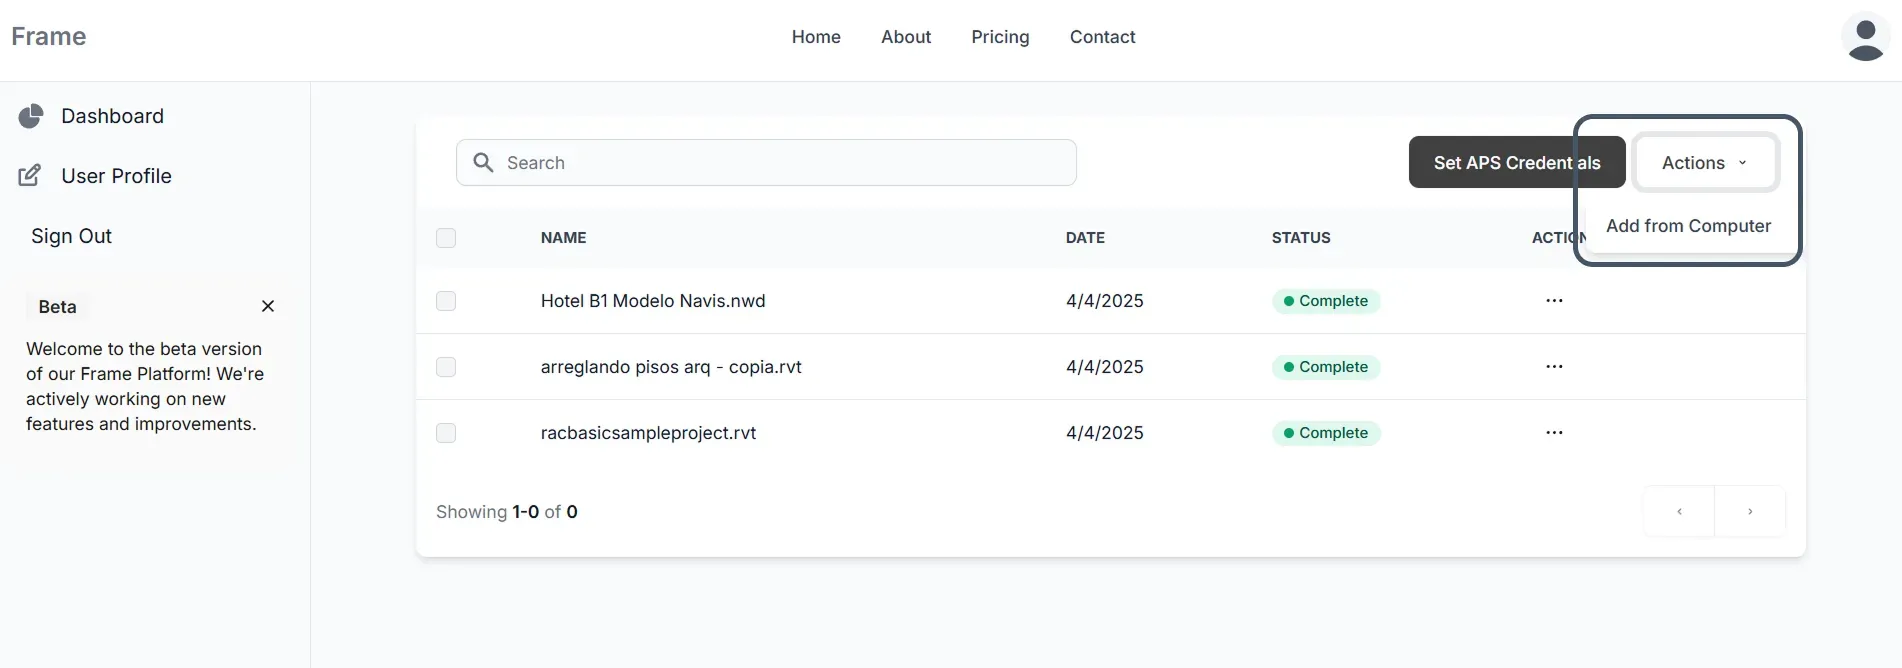
2. Generate and download your Power BI template
Once your model is processed, Frame creates a custom Power BI template just for your data. Download the .pbit file to your computer.
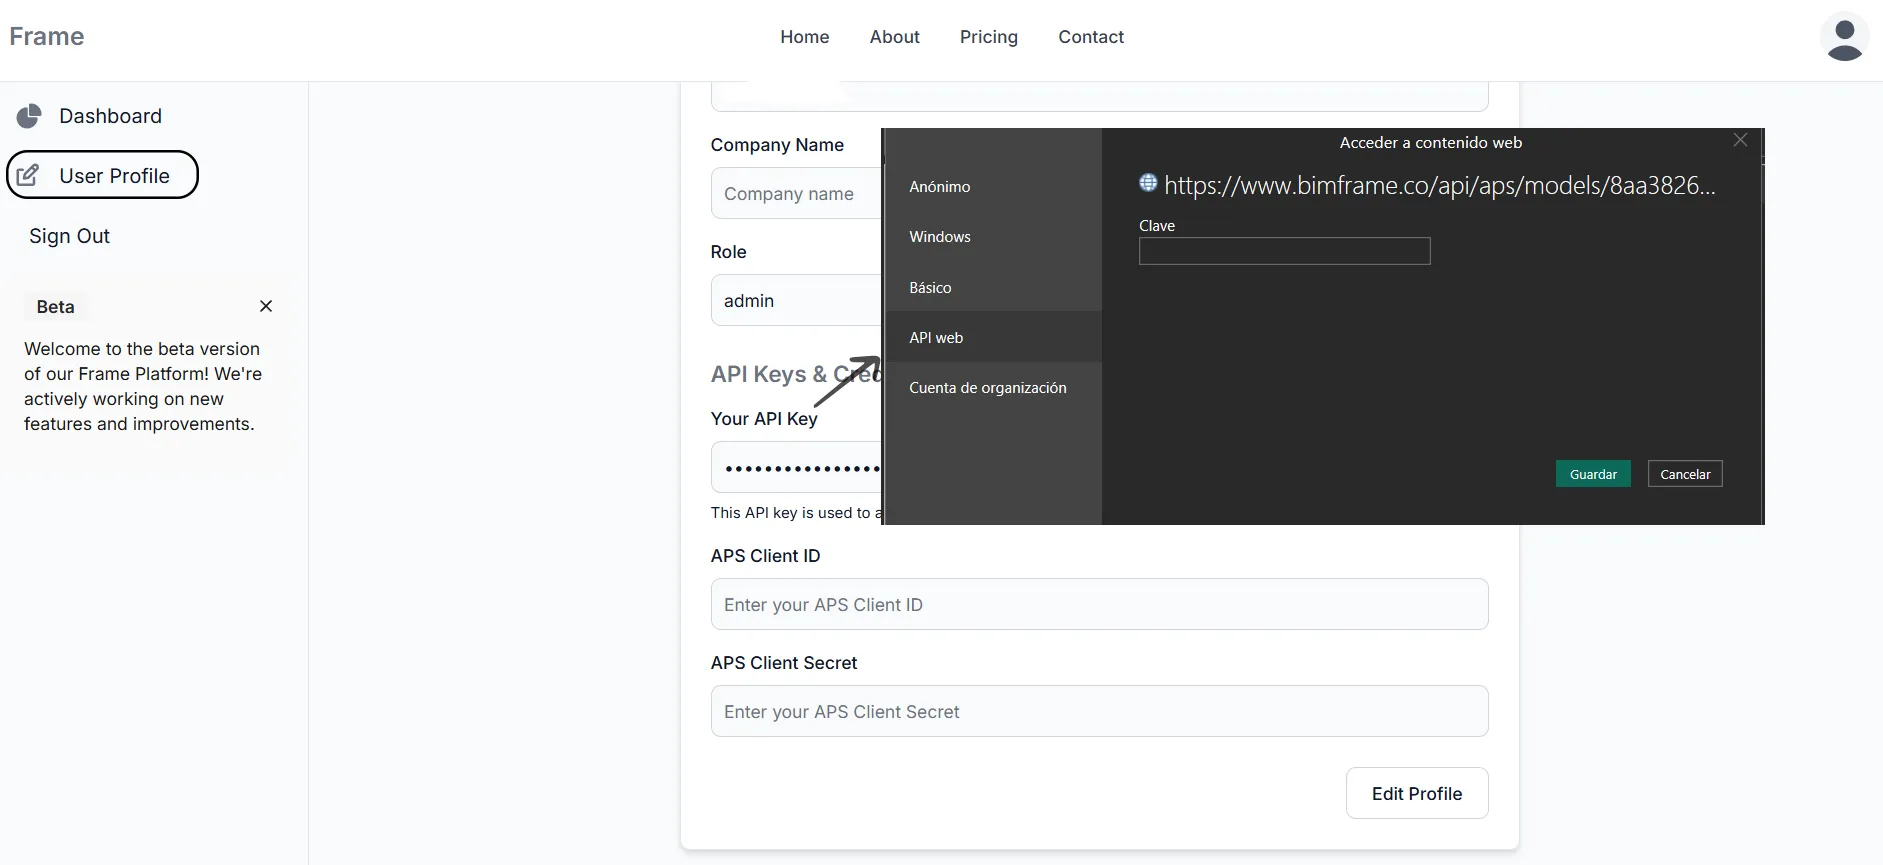
3. Open the template and authenticate
Open the file in Microsoft Power BI Desktop. When prompted, enter your credentials from your Frame user profile. This keeps your data secure and only accessible to authorized users.
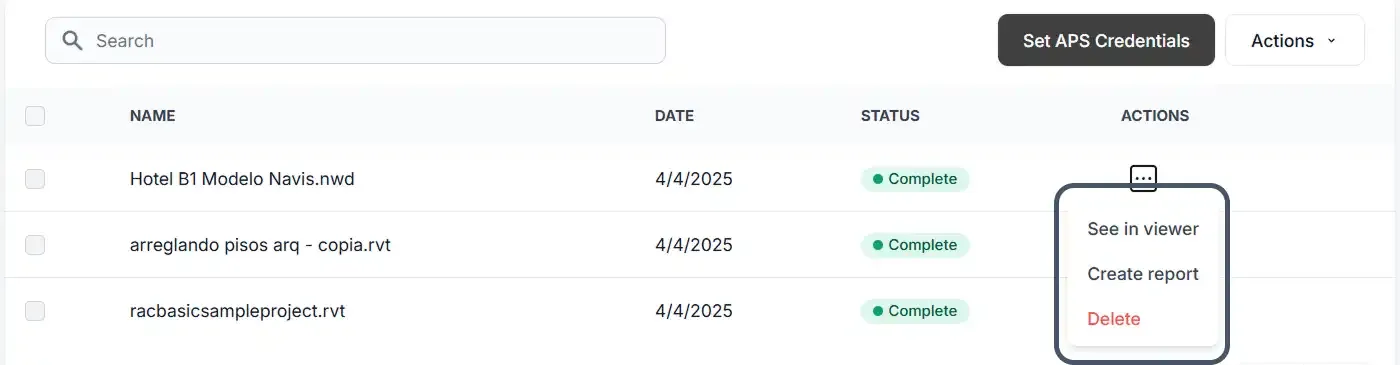
4. Explore and customize your report
Power BI populates your starter report with pre-built pages for:
- Quantity takeoffs
- Progress tracking
- Cost analysis
Tweak the visuals to match your brand, add new pages, or pull in extra data from ERP systems or project schedules.
What’s next?
Now it’s your turn. Experiment, customize, and see how much more you can do with your data.
Ready to turn your construction models into business intelligence? Get started with Frame today.