Frame's Custom Viewer for Power BI: Interactive 3D BIM Analytics
Embed interactive 3D BIM models in Power BI with Frame's custom viewer featuring bidirectional filtering and advanced analytics.

Frame Team
Introduction
Power BI excels at transforming complex datasets into actionable insights, but when managing BIM projects, traditional charts and tables fall short. To truly understand construction issues, quantity take-offs, or clash detection results, you need to visualize the data within its 3D spatial context.
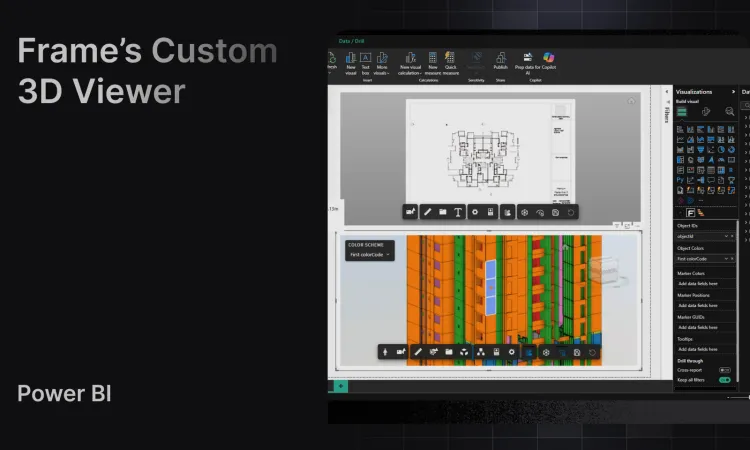
Frame’s Autodesk Power BI Custom Viewer solves this challenge by embedding fully interactive 3D models directly into your Power BI dashboards. Built on Autodesk Forge Viewer technology, it creates a seamless connection between your BIM data and Power BI’s analytics capabilities.
The result? Project teams can explore Revit models, filter elements by properties, highlight issues in real-time, and make data-driven decisions without switching between multiple software platforms. Whether you’re a project manager reviewing schedules or a BIM coordinator tracking clashes, Frame brings the geometry and the data together in one place.
Power BI Custom Visuals: How They Work
Power BI’s extensibility framework allows developers to create custom visuals that go far beyond native charts and graphs. These are specialized web applications built with TypeScript, HTML5, and visualization libraries that integrate directly into Power BI’s report canvas.
For BIM professionals, this extensibility unlocks powerful possibilities: instead of viewing 3D models in separate software, you can embed interactive 3D viewers directly alongside your project KPIs, cost data, and schedule metrics.
Frame leverages this capability by integrating the Autodesk Forge Viewer (the same technology that powers Autodesk Construction Cloud) into a Power BI custom visual. This isn’t just a static 3D preview. It’s a fully interactive viewer that responds to filter selections, data clicks, and user inputs, creating true bidirectional synchronization between your analytics and your model geometry.
Is There a Power BI Viewer?
Yes, several companies have developed 3D viewers for Power BI to support BIM and CAD visualization, but their approaches and capabilities vary significantly:
- Speckle provides an open-source viewer with strong interoperability, but requires migrating models to Speckle’s cloud infrastructure rather than using Autodesk’s native hosting. Additionally, this option does not support viewing multiple 2D sheets within the Power BI environment.
- Autodesk Data Exchange (ADX) offers a first-party connector with Forge Viewer integration, though it’s primarily designed for basic model viewing rather than advanced analytics workflows. It also lacks support for custom extensions to the Autodesk viewer, limiting its ability to adapt to specialized BIM use cases.
- VCAD delivers a highly reliable 3D viewer for Power BI, offering dependable performance and seamless BIM integration, but its subscription method is more rigid compared to other solutions.
Frame’s Approach
Frame’s Power BI custom viewer is purpose-built for BIM analytics teams who need more than basic 3D visualization. We use Autodesk’s official Forge Viewer as the foundation, then extend it with advanced features developed specifically for construction and architecture workflows.
After working extensively with project teams using Power BI for BIM analytics, we identified critical gaps: the need for better element isolation, dynamic color-coding by properties, saved camera states, and seamless integration with 2D Revit sheets. Frame’s viewer delivers these capabilities out of the box, making it the most comprehensive solution for teams that want their 3D models and analytics working in perfect harmony.
Power BI 3D Model Viewer: Frame’s Custom Features
Frame Custom Viewer Demo Video
Frame’s 3D model viewer transforms Power BI from a reporting tool into an interactive BIM analytics platform. Here are the key features that differentiate it from basic 3D visualization tools:
1. Bidirectional Filtering
Click any element in the 3D model, and all Power BI visuals instantly filter to show data for that selection: quantities, costs, schedules, or custom properties. Conversely, select a data point in a chart (like all walls of a specific fire rating), and those elements highlight in the 3D viewer.
Use case: A project manager clicks on elements shown as “behind schedule” in a Gantt chart visual, and the viewer immediately isolates and highlights those components in 3D, revealing spatial patterns in construction delays.
2. Dynamic Property-Based Color Coding
Apply conditional formatting rules directly to the 3D model based on any property: discipline, construction status, cost variance, material type, or custom parameters. Color gradients make it easy to spot outliers and trends at a glance.
Example: Color-code structural elements by concrete strength (green for standard, yellow for high-strength, red for ultra-high-performance) to visually validate design intent across the model.
3. Element Isolation and Ghosting
Isolate specific elements or element categories while ghosting the rest of the model for spatial context. This feature is essential for reviewing specific systems (MEP, structural, architectural) without losing orientation within the building.
Benefit: Review only HVAC ductwork while maintaining a ghosted building shell, making coordination reviews faster and more focused.
4. Seamless 3D and 2D View Switching
Toggle between full 3D models and 2D Revit sheet views (floor plans, elevations, sections) without leaving Power BI. All filtering and interactions work consistently across both view types.
Why it matters: Stakeholders unfamiliar with 3D navigation can review the same filtered data on familiar 2D construction documents.
5. Markers, Annotations, and Data Tooltips
Pin markers to the model for issues, clashes, RFIs, or custom annotations. Hover over any element to display rich property tooltips showing metadata like element ID, type, dimensions, cost, or custom calculated fields from your Power BI dataset.
Application: Display Navisworks clash detection results as markers with severity color-coding, then click to see full clash details and affected element properties.
6. Saved Viewer States
Capture and save complete viewer configurations (camera angle, zoom level, isolated elements, color rules, and visibility settings) for instant recall. This is invaluable for recurring project reviews, client presentations, or QA/QC checkpoints.
Scenario: Save a “structural review” state that isolates columns and beams, applies color-coding by load capacity, and positions the camera at a specific angle, then restore it with one click for weekly meetings.
7. High-Performance Large Model Support
Frame’s viewer is optimized for large, complex BIM models with extended data row limits in Power BI. Navigate massive Revit files, federated models, or IFC assemblies smoothly without lag or crashes.
Technical edge: Support for models with large number of elements, maintaining interactive frame rates even when applying complex filters and color rules.
These features combine to make Frame’s viewer the most powerful 3D BIM analytics tool available for Power BI, purpose-built for construction, architecture, and engineering workflows.
How to Connect Autodesk to Power BI
Before you can use Frame’s 3D viewer, you need to connect your Autodesk BIM data to Power BI. This involves extracting element properties, quantities, and metadata from Revit, IFC, or Navisworks files, whether stored locally or in Autodesk Construction Cloud.
Frame handles this entire process automatically: from file upload to data extraction, transformation, and Power BI integration. The platform normalizes units, structures hierarchies, and prepares clean datasets ready for analysis, all while embedding the 3D viewer directly into your reports.
Learn More About Connecting BIM Data to Power BI
We’ve written comprehensive guides covering different aspects of the Autodesk to Power BI workflow:
-
Practical Power BI and Revit Dashboards for Project Management: Complete step-by-step guide comparing connection methods and building your first BIM dashboard
-
BIM and Power BI Integration for Digital Twins: Deep dive into transforming Revit models into interactive digital twins with Power BI analytics
-
Revit and Power BI Templates That Work: How to use Frame’s pre-built templates to accelerate dashboard creation
Does the Power BI Viewer Require a License?
Frame’s 3D model viewer is included with your Frame subscription, with no additional fees, no per-user licensing, and no hidden costs for viewer access.
Here’s what you need:
-
Power BI License: You’ll need Power BI Pro or Premium to publish and share reports (standard requirement for any Power BI deployment).
-
Frame Subscription: Includes data extraction, processing, the custom viewer visual, and ongoing updates. All team members with Power BI access can interact with the 3D viewer without separate Frame licenses.
-
Autodesk Account: If using models from Autodesk Construction Cloud, you’ll need appropriate ACC/BIM 360 access to the source files.
Unlike some competitors that charge per-viewer or per-project fees, Frame’s pricing is transparent and predictable. Once you’re subscribed, all features, including the advanced 3D visualization capabilities, are available across all your projects and reports.
Summary
Frame’s Autodesk Power BI Custom Viewer fundamentally changes how BIM teams interact with project data. Instead of switching between Revit, Navisworks, Power BI, and spreadsheets, everything comes together in one interactive dashboard.
Key capabilities:
- Bidirectional filtering between charts and the 3D model
- Property-based color coding for instant visual analysis
- Element isolation and ghosting for focused reviews
- 3D and 2D view modes for all stakeholder types
- Saved viewer states for recurring reviews and presentations
- High-performance rendering even with massive models
By extending Autodesk’s Forge Viewer with purpose-built BIM analytics features, Frame transforms Power BI from a reporting tool into a true project intelligence platform where data and geometry work in perfect synchronization.
Conclusion
The construction and architecture industries are moving beyond static reports and disconnected tools. Modern project teams need integrated platforms where BIM data, cost tracking, schedule analysis, and quality management live together, accessible to both technical and non-technical stakeholders.
Frame’s Autodesk Power BI Custom Viewer bridges this gap. Whether you’re a BIM coordinator reviewing clash detection results, a project manager tracking progress against schedule, or an executive analyzing portfolio-wide trends, the combination of Power BI’s analytics power and Frame’s 3D visualization delivers insights that were previously impossible to access.
Ready to see your BIM data in a new light?
👉 Explore Frame’s Power BI Custom Viewer and transform how your team works with BIM analytics.