Practical Power BI and Revit Dashboards for Project Management
Complete guide to building Power BI dashboards from Revit models. Compare tools, learn best practices, and transform your BIM data into actionable insights.

Frame Team
Introduction
Managing construction and design projects is no longer just about drawings and schedules—it’s about data. Today, the most successful project teams are those that rely on real-time, accurate information to make decisions. By combining Power BI, Revit, and dashboards, project managers can merge design data with business insights, turning complex BIM information into something clear and actionable.
At Frame, we’ve worked on projects of all sizes and have seen how this integration can be a true differentiator. In this article, we’ll walk through the basics of Power BI and BIM, explore different ways to connect Autodesk models to Power BI, and show how our tool, Frame, helps you get the most out of your BIM dashboards.
Power BI & BIM
The integration of Power BI and BIM is more than a technical feature—it’s a mindset shift. Instead of relying on static spreadsheets or scattered reports, project stakeholders can visualize model-based data in interactive dashboards.
We firmly believe the future of construction relies on decision-making based on accurate, real-time data. From our experience in multiple projects, we can confirm that this approach not only improves efficiency but also strengthens collaboration and transparency between teams.
With BIM data inside Power BI dashboards, you can:
- Monitor project progress against planned timelines
- Validate quantities and costs in real time
- Track issues and clashes directly in reports
- Communicate insights to non-technical stakeholders
Is Power BI for Project Management?
Strictly speaking, Power BI was not designed as a project management tool. But in practice, it has become one of the most flexible and powerful solutions for managing project information.
The reason? Power BI can pull data from almost any source:
- ERP systems for costs and resources
- Revit design metadata for geometry, quantities, and properties
- Asset data for operations and facilities management
- Construction field updates for real-time tracking
- Even simple spreadsheets or complex internal databases
By merging these sources into one place, Power BI dashboards give project managers the complete picture: time, cost, scope, quality, and risk. This level of integration is hard to achieve with traditional project management software.
How to Connect Autodesk to Power BI
There are several ways to connect Autodesk models with Power BI. Each solution has its strengths and weaknesses. Let’s break them down:
Autodesk Data Exchange
Autodesk’s native solution for connecting BIM models to Power BI.
- ✅ Direct integration with Autodesk Construction Cloud (ACC)
- ❌ Limited only to ACC subscribers
- ❌ No pre-made templates or clean datasets—dashboards can take longer to set up
- ✅ Strong for teams already locked into ACC
VCAD
A long-standing tool for BIM–Power BI integration.
- ✅ Provides clean datasets and some pre-built templates
- ✅ Reliable solution with a custom model viewer inside Power BI
- ❌ Outdated UI that feels less user-friendly
- ❌ Slot-based billing can make it more expensive than other options
Speckle
An open-source alternative that avoids using Autodesk’s custom viewer.
- ✅ Lower cost with a self-host option for advanced users
- ❌ Requires hosting models outside Autodesk’s cloud, which many companies cannot allow
- ❌ Lacks templates or clean datasets—more setup is needed
- ❌ No Autodesk native viewer features (first-person view, measurements, cut planes, etc.)
Frame
At Frame, we’ve taken inspiration from all these tools and built a solution that eliminates their weaknesses. Here’s what sets us apart:
- Ready-to-use templates: Starter, File Versioning, Clash Detection, Quantities, and Issue Tracking for ACC models
- Clean, optimized datasets: Structured for every Revit view, so reports are ready to use immediately
- Custom Power BI viewer: Includes rule-based coloring, ghosting, isolation, bidirectional filters, and even 2D sheet interaction from Revit files
- Support for both local and ACC models in a single platform
- AI-powered features: Natural language queries, markups, and a chatbot that makes BIM data accessible to all team members
- Excel integration: Edit datasets directly in Excel and sync them back to Power BI
Frame is built from real-world project challenges, combining the best features of the alternatives while making dashboards cleaner, faster, and easier to build.
How to Use Power BI in Revit
Connecting Revit models to Power BI usually involves three steps:
- Extract the metadata from Revit files (using tools like Data Exchange, VCAD, Speckle, or Frame).
- Transform the data into a structured dataset for reporting.
- Visualize it inside Power BI using dashboards and interactive visuals.
The challenge lies in steps 1 and 2. Without a clean dataset, project teams spend hours in Power Query transforming and merging information before dashboards become usable.
With Frame, much of this work is already done. Our integration provides datasets that are ready-to-use along with templates for common project needs. That means you can go from model to dashboard in minutes, not days.
Data Management for BIM Models with Power BI and Dashboard Templates
Once the data is connected, it usually needs cleaning. In many workflows, this involves:
- Pivoting columns
- Merging queries
- Grouping values
- Creating custom fields
Power BI’s native Power Query handles this well, but depending on the connector, this process can take significant time.
That’s why Frame delivers pre-cleaned datasets. Instead of starting from scratch, you get structured data aligned with BIM best practices. Combined with our pre-built Power BI templates, you can quickly build dashboards for:
- Quantities
- Clash detection
- File versioning
- Issues tracking
This approach saves time and ensures consistency across projects.
Does Power BI Have a Gantt Chart?
One of the most frequent requests from project teams is to display schedules inside Power BI.
The answer is yes: Power BI supports custom visuals, including Gantt charts. By importing your project schedule (from Microsoft Project, Primavera, or even Excel), you can display tasks, durations, and milestones in a Gantt chart within Power BI.
The real power comes when you combine that schedule with BIM model data. For example, you can:
- Link schedule tasks with Revit model elements
- Compare planned vs. actual progress
- Visualize both time and spatial data in one dashboard
This makes Power BI + Revit dashboards far more powerful than using standalone scheduling tools.
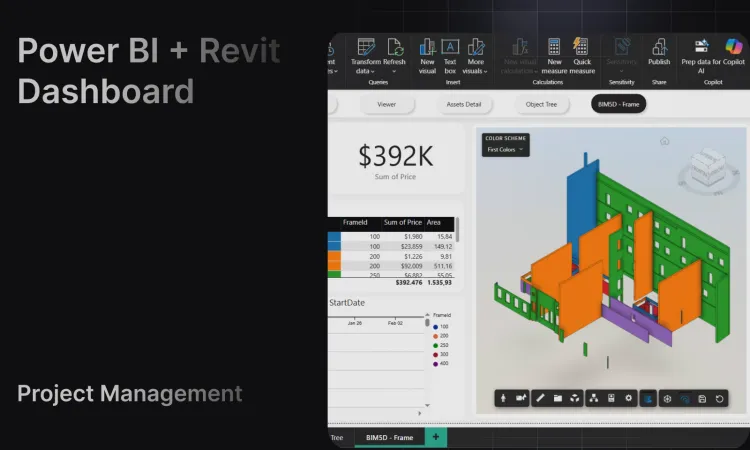
BIM 5D Simulation with Gantt Chart and Frame Report
Below, you can find a sample of what’s possible with a BIM 5D simulation, integrating a Gantt chart and a comprehensive report using Frame. This interactive dashboard allows you to visualize project schedules alongside your BIM model data, providing real-time insights into progress and potential conflicts, making it easier to track progress and manage resources.
Summary of Benefits for Using Frame
Here’s why Frame is the best solution for connecting Power BI with Revit dashboards:
- Faster setup thanks to ready-to-use templates
- Clean datasets optimized for Revit projects
- Custom viewer integrated inside Power BI reports
- Support for both local and ACC models
- AI chatbot and markup tools for easy collaboration
- Excel integration for editing datasets in familiar tools
In short, Frame helps project teams spend less time cleaning data and more time making better decisions.
Conclusion
The combination of Power BI, Revit, and dashboards is changing how projects are managed. By integrating model data with schedules, costs, and field updates, teams can create a single source of truth that drives efficiency and collaboration.
While solutions like Autodesk Data Exchange, VCAD, and Speckle offer partial answers, Frame provides the most complete, practical, and user-friendly way to connect BIM with Power BI.
If you want to turn your BIM data into actionable insights, Frame is the tool to get you there.