BIM and Power BI Integration for Digital Twins
Transform your Revit models into powerful digital twins by connecting BIM data to Power BI. Create interactive 3D dashboards with Frame's ready-made templates.

Frame Team
At Frame, we’re witnessing a data revolution in the construction industry. As Building Information Modeling (BIM) matures, we believe its true value lies not just in 3D visualization, but in the wealth of data embedded within these models. Every Revit model is a powerful database in disguise, holding detailed information on material quantities, cost estimates, and scheduling. However, we see this as just the first step toward a more dynamic and powerful concept: the Digital Twin.
Deconstructing the Core Concepts: BIM, BIM Dimensions, and Digital Twins
To fully grasp the power of this evolution, it’s helpful to break down the key ideas. We often see these terms used interchangeably, but they represent distinct, compounding concepts.
1. BIM: The Foundational Blueprint
First, let’s talk about Building Information Modeling (BIM). It’s much more than just a 3D model. We see BIM as a process for creating and managing information on a construction project throughout its whole lifecycle. While the 3D model is the visible result, the real innovation lies in the process itself. It serves as a shared, data-rich resource—a digital blueprint where every element contains intelligent information.
2. The BIM Dimensions: Adding Layers of Intelligence
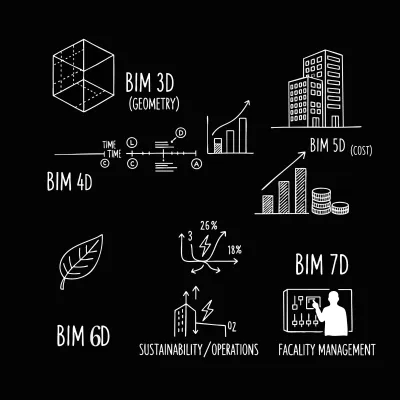
This is where it gets really interesting. The initial 3D model is just the beginning. We can layer additional “dimensions” of data onto it to unlock deeper insights:
-
BIM 3D (Geometry): This is the familiar three-dimensional model of the asset (x, y, z). It helps us visualize the space and coordinate designs.
-
BIM 4D (Time): Here, we add scheduling data to the model. This allows us to create construction simulations, plan phasing, and visualize the project timeline, helping to identify potential conflicts before they happen on site.
-
BIM 5D (Cost): By linking model components to cost data, we can automate quantity takeoffs and generate real-time cost estimates. This dimension transforms the model into a powerful tool for budget analysis and financial control.
-
BIM 6D (Sustainability/Operations): This dimension focuses on the asset’s lifecycle. It can include data for energy analysis, helping to optimize performance and sustainability, or operational information for future maintenance.
-
BIM 7D (Facility Management): The final layer incorporates asset data needed for ongoing facility management, such as manufacturer details, maintenance schedules, and warranty information, right into the model.
The Data Goldmine in BIM Models
Too often, this valuable data remains locked inside design files, unable to inform critical business decisions. The challenge isn’t a lack of data, but making it accessible, actionable, and meaningful for all project stakeholders throughout every project phase. This is where Power BI transforms static BIM information into dynamic, interactive insights, and platforms like Frame further bridge this gap by making your models the single source of truth, visible, shareable, and collaborative.
Why We Believe Integrating Power BI and BIM is a Game-Changer
Power BI closes the gap between complex BIM data and business intelligence. We’re convinced that integrating these tools is a critical step toward building a Digital Twin, unlocking several key capabilities for your team. In the following, we’ll highlight not only the capabilities enabled by this integration, but also the tangible benefits we’ve experienced firsthand while working with these kinds of tools.
-
Visualize BIM Dimensions: Go beyond 3D by connecting your model to Power BI to analyze 4D (time) and 5D (cost) data, allowing you to track schedules and budgets visually.
-
Integrate with ERP Data: Connect your BIM model to your company’s ERP system. This creates a holistic view by linking design and construction data with financials, procurement, and resource management.
-
Centralize Information: Create a single source of truth where all stakeholders can access and interact with the same up-to-date information, breaking down data silos between design, project management, and finance teams.
-
Build a Historical Record for the Future: Every piece of data captured creates a rich historical database. This not only improves tracking on your current project but also provides invaluable data for forecasting and optimizing future ones.
This integration is revolutionizing data-driven decision-making in construction, with Frame specifically designed to transform BIM data into measurable business outcomes at every project stage.
How We Make Integration Practical
Modern tools are transforming static models into data-rich visualization platforms. While solutions like Speckle and Autodesk Data Exchange are available, Frame was built as an end-to-end answer for this exact challenge.
Why Frame?
Frame offers an integrated workflow by directly connecting your Autodesk and IFC models with Power BI, focusing on performance and ease of use:
-
Direct Integration: Connect Autodesk and IFC models to Power BI without manual conversions.
-
Optimized Data Processing:
- Models are processed and hosted to create highly optimized datasets.
- Ensures Power BI reports remain fast and responsive, no matter the size or complexity of your models.
-
Interactive Visualization:
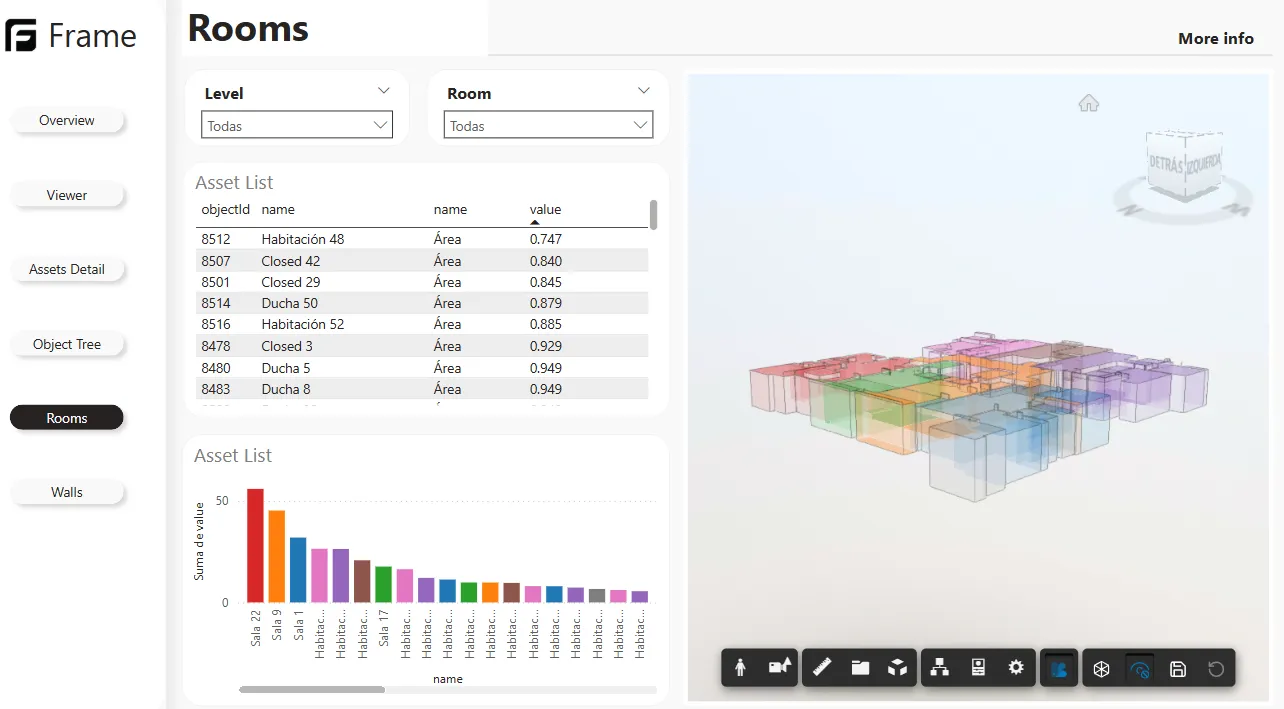
- Utilize a custom Power BI visual for live, interactive 3D exploration, with advanced features such as saving views directly within your report pages for easy access and sharing.
- Interact directly within dashboards to filter, slice, and color-code model elements using any data in your report.
-
Dynamic Data-Design Link: Create a true two-way connection between your project data and visual design for deeper insights.
-
Accelerated Setup: Download ready-made templates to get to valuable insights quickly.
This approach ensures a streamlined, high-performance journey from model to actionable insight, tailored for professionals dealing with complex datasets and designs.
The Three-Step Workflow
-
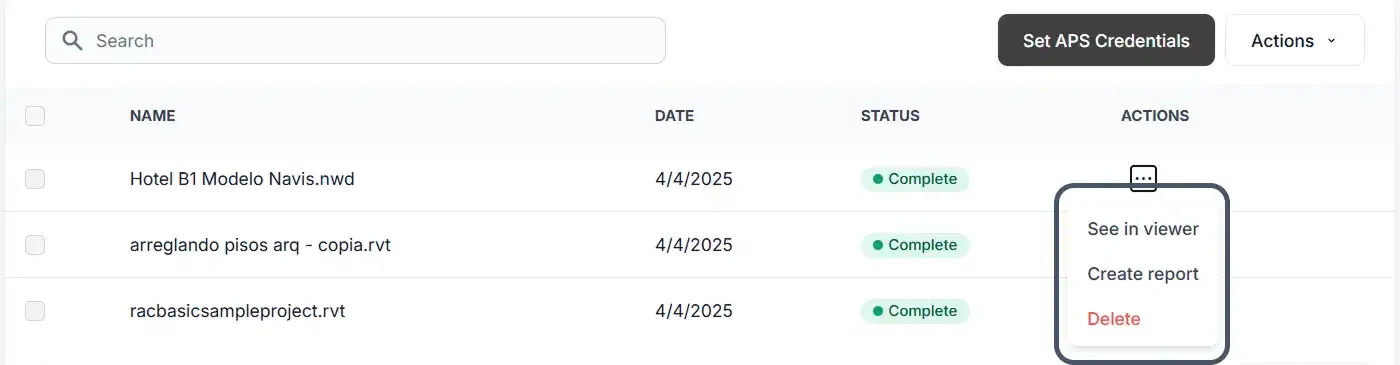
Send from Revit: Use connectors like Speckle or upload directly to Frame to push model data to the cloud.
-
Receive in Power BI: Import data using specialized connectors, or leverage Frame’s Power BI templates with embedded 3D models and pre-built datasets.
-
Visualize in 3D: Display interactive models alongside traditional charts and graphs, with Frame offering bi-directional filtering and color-coding based on any data field.
Transforming Your Project Management
Integrating Revit, Power BI, and BIM is fundamentally changing project management through:
- Visual progress monitoring: Track construction progress against BIM models in real time
- Resource optimization: Analyze material usage and identify inefficiencies
- Cost control: Build dynamic dashboards that update automatically
- Quality assurance: Visualize inspection data and simulate the impact of potential issues
Interactive 3D dashboards empower stakeholders to drill down into specific model elements—materials, costs, timelines—enabling early issue detection and faster, more informed decisions.
Our Best Practices for Your Success
Data Preparation
- Ensure Revit models have consistent, high-quality parameter data
- Standardize naming conventions across projects
- Add relevant parameters to elements for comprehensive data collection
- Conduct regular model audits to maintain data integrity
Visualization Strategy
- Select appropriate chart types (bar charts for comparisons, line charts for trends)
- Use conditional formatting to highlight critical metrics
- Apply color-coding to enhance data visualization
- Implement interactive filters for drill-down analysis
Performance Optimization
- Export only necessary data to keep files manageable
- Use aggregated tables for large datasets
- Leverage Power Query for data normalization and creating datasets from existing data, rather than relying on complex DAX calculations
- Optimize refresh schedules based on project needs
Where are we heading?
While a BIM model is a rich but often static representation, a Digital Twin is a living, virtual replica of a physical asset. For us, this is where the future lies. A Digital Twin is continuously updated with real-time data from its physical counterpart, creating a powerful bridge between the physical and digital worlds.
Your BIM model is the perfect foundation. When you connect its data to real-time feeds from IoT sensors, drones, and operational systems, you create a dynamic model ready for advanced analysis. We’ve seen this evolution unlock powerful new benefits for our users:
Advanced Simulation: The true power of a Digital Twin is its simulation layer. It allows you to run “what-if” scenarios to assess the impact of different decisions before they are made in the real world. This helps optimize throughput, cost, and safety months or even years in advance.
Improved Efficiency and ROI: Digital Twins can improve capital and operational efficiency by 20% to 30%. By enabling a “dig once” policy and identifying bottlenecks before a project begins, they minimize disruption, decrease costs, and reduce delays.
Operational Optimization: In a building’s operational phase, a Digital Twin can identify bottlenecks, streamline operations, and improve resilience, leading to significant cost reductions.
Getting Started
With tools and technologies more accessible than ever, teams can start with simple schedule exports or implement sophisticated real-time dashboards. Begin with clear objectives and build capabilities gradually.
Remember, successful integration requires not just new technology, but also changes in business processes, workflows, and a commitment to training and change management. Organizations investing in both technical infrastructure and human capabilities will unlock the full potential of their BIM data.
Ready to transform your BIM data into actionable insights? Consider exploring Frame’s beta program or book a demo to see how its comprehensive features can enhance your BIM workflow.
The future of construction is data-driven, and the integration of Revit, Power BI, and BIM is lighting the way forward.