Power BI for construction dashboards
Learn how Power BI revolutionizes construction management by transforming complex BIM data into visual, actionable insights for real-time project monitoring.

Frame Team

Power BI is revolutionizing the construction industry by transforming complex project data into visual, actionable insights. This powerful business intelligence tool enables real-time monitoring, informed decision-making, and improved efficiency across construction projects. By integrating with Building Information Modeling (BIM), Power BI helps construction managers effectively track project timelines, resource allocation, and budgets. Furthermore, Power BI provides customizable dashboards that make technical data accessible to stakeholders at all levels, enhancing collaboration and transparency. This integration significantly improves the return on investment from digital engineering tools, including BIM software licenses and other technological investments, by maximizing their utility and ensuring that the wealth of data they generate translates into tangible project benefits and operational improvements.
Real-Time Project Monitoring Dashboards
Think of a real-time project monitoring dashboard as your car’s dashboard, but for construction projects. Instead of showing speed and fuel levels, it displays your project’s vital signs at a glance. These digital dashboards pull live data from the field, showing you exactly what’s happening on your construction site right now—not yesterday or last week.
- Live updates: When team members complete tasks or fill out forms, the dashboard refreshes automatically, giving you the most current information.
- Visual clarity: Colorful charts and graphs make complex data easy to understand, like red, yellow, and green indicators showing if things are on track.
- Problem spotting: Dashboards highlight issues before they become disasters, similar to how your car’s warning lights alert you to problems.
- One-stop view: All critical information appears on one or two screens, eliminating the need to juggle multiple spreadsheets or apps.
- Decision support: With real-time data at your fingertips, you can make quick, informed decisions rather than relying on outdated reports.
BIM-Power BI Integration Benefits
Imagine BIM as a detailed digital blueprint of your building and Power BI as special glasses that help you see patterns and insights hidden within that blueprint. When combined, they create a powerful toolkit that transforms construction management:
- Visual understanding: See your 3D building model right inside Power BI dashboards, making it easier to spot issues and understand spatial relationships without switching between programs.
- Data democratization: Everyone on the team gets access to the same information, encouraging better collaboration and a healthier work culture.
- Automated reporting: Pre-built templates can automatically generate reports at regular intervals, saving time and ensuring everyone has up-to-date information.
- Real-time decision making: Instantly see how changes might affect your project timeline or budget through interactive visualizations.
- Post-construction benefits: The integration continues to provide value after construction ends, helping with facility management and long-term building maintenance.
Construction Cost Analysis Visualization
Imagine your construction project costs as a jigsaw puzzle – Power BI helps you put all the pieces together into a clear picture. With cost analysis visualizations, you can transform confusing spreadsheets of numbers into colorful charts that tell the story of where your money is going.
- Budget tracking: Create interactive dashboards that compare actual vs. planned expenses, with color-coded alerts when costs exceed budgets.
- Cost breakdown visuals: See exactly how your budget is distributed across labor, materials, and equipment through intuitive donut charts.
- Historical comparisons: Compare current project costs with similar past projects to spot trends and improve future estimates[4]
- Cost-per-unit analysis: Visualize expenses per square foot or other relevant metrics to benchmark performance across different projects.
- Real-time updates: As new expenses come in, your visualizations automatically refresh, giving you up-to-the-minute financial insights.
- What-if scenarios: Test how potential changes might impact your bottom line before making decisions.
Frame’s Power BI Integration
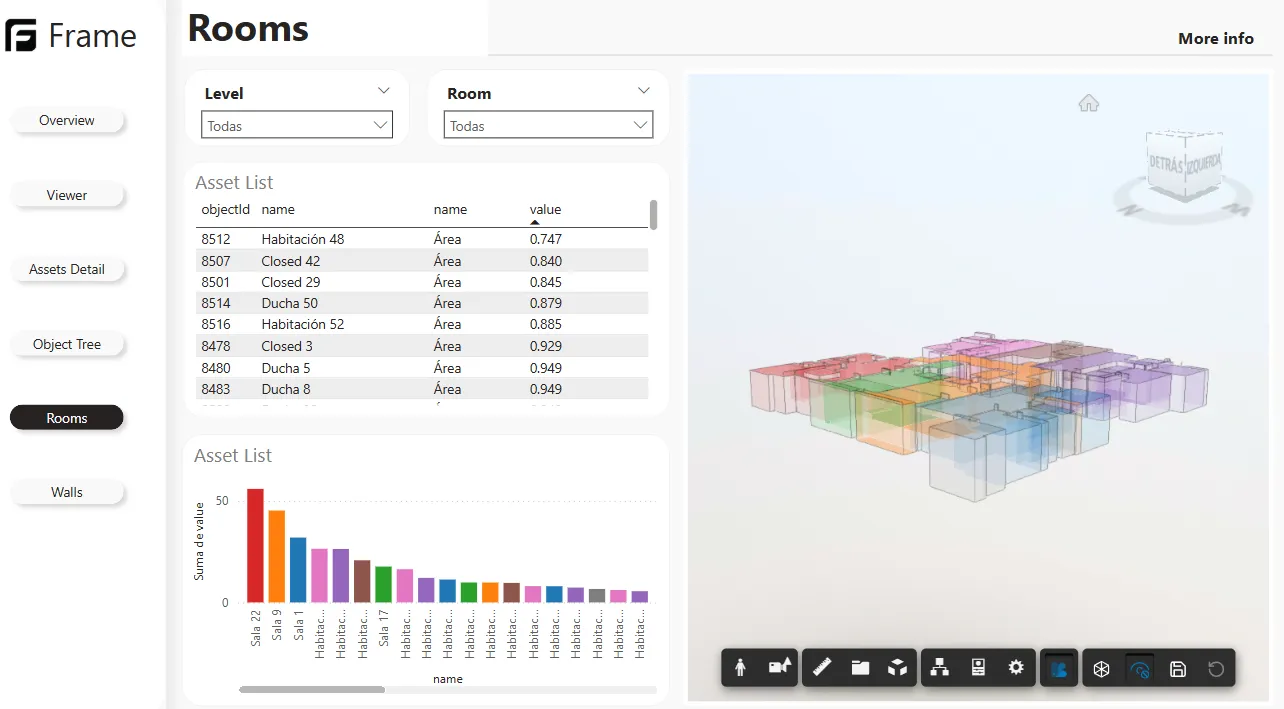
Think of Frame as a bridge connecting your 3D building models directly to your Power BI dashboards. Unlike traditional approaches where BIM data gets lost in translation, Frame lets you embed live Autodesk and IFC models right inside your Power BI reports. This means you can click on a 3D model element and instantly see related data, or click on a chart and watch the corresponding parts of your building light up.
- Interactive 3D models: Embed actual building models in your dashboards instead of just static charts.
- Two-way filtering: Click on charts to highlight model elements or click on the model to filter your data.
- Color-coded insights: Apply color rules to your model based on any data field, making problems visually obvious.
- Persistent views: Save specific model views and filters so you can pick up exactly where you left off.
- Automated templates: Frame automatically processes your BIM data and creates Power BI templates tailored for construction analytics.
Learn more about this feature on our Power BI integration page.
Final Thoughts
Power BI has become a game-changer for the construction industry, transforming how companies handle the mountains of data generated throughout project lifecycles. Like having a powerful magnifying glass that reveals hidden patterns in complex information, Power BI helps construction professionals make sense of their data and turn it into actionable insights.
- Centralized data hub: Power BI pulls information from various sources into one place, eliminating the frustration of hunting through different systems.
- Real-time decision making: Instead of waiting for weekly reports, managers can see what’s happening right now and respond immediately to issues.
- Simplified complexity: Complex construction data becomes easy-to-understand visuals, making technical information accessible to everyone from site managers to executives.
- Future-proofing: Construction companies that embrace data-driven approaches using Power BI are positioning themselves to thrive in an increasingly competitive industry.
By bridging the gap between raw data and meaningful insights, Power BI is helping construction companies build not just structures, but smarter, more efficient businesses.