How to Create BIM Quantity Takeoffs for Construction in 2025?
Learn how to create accurate BIM Quantity Takeoffs (QTO) in minutes using Power BI and Frame. A step by step guide to modern construction estimation.

Frame Team
Introduction
What is BIM Quantity Takeoff?
If you work in construction, you know that accurate estimations are the backbone of any successful project. A Quantity Takeoff (QTO) is the detailed measurement of materials and labor needed to complete a construction project.
But how is a BIM Quantity Takeoff different from a normal one? Traditionally, takeoffs were done manually from 2D drawings, a process prone to human error and notoriously slow. BIM (Building Information Modeling) changes the game by allowing us to extract quantities directly from the 3D model geometry.
Why is it called a “quantity takeoff”? It refers to “taking off” the quantities from the blueprints (or in this case, the model) to prepare a bill of quantities (BOQ) or cost estimate.
Manual vs. BIM Takeoffs (at a glance)
| Aspect | Manual (2D sheets) | BIM (model based) |
|---|---|---|
| Source of truth | 2D drawings | 3D geometry plus metadata |
| Update cycle | Rework on each revision | Refresh from the model |
| Granularity | Limited to what is visible | Full properties (family, material, level) |
| Shareability | Stale spreadsheet exports | Live dashboards (Power BI) |
| Color coding | Manual view filters | Driven by any property |
What data do you actually need?
- Geometry based measures: Area, Volume, Count, Length.
- Context fields: Category, Family/Type, Level, Phase, Material, Workset.
- Identifiers:
externalId/ GUIDs to keep rows tied to the model through every export and refresh.
How to Create a Quantity Takeoff from Revit?
To create a quantity takeoff in Revit, use Schedules/Quantities or Material Takeoff schedules from the View tab, then add, sort, and filter fields to report the elements or materials you want.
Choose schedule type
- Element based quantities (columns, beams, doors): View → Schedules → Schedules/Quantities and pick the category (Structural Columns, Walls, Doors).
- Material based quantities (brick, concrete, finishes): View → Schedules → Material Takeoff and choose the host category (Walls, Floors).
Add key fields
- Move fields from Available to Scheduled: Family and Type, Level, Count, Length, Area, Volume, and any cost or weight parameters.
- For material takeoffs, add Material: Name, Material: Area/Volume, Material: Cost, and any descriptions needed for estimating.
Sort, group, and total
- Use Sorting/Grouping to sort by Level, Type, or Material and enable Grand totals.
- Uncheck Itemize every instance if you want one summarized line per type or material.
Filter and refine
- Use Filter to include only relevant levels, phases (New vs Existing), or specific materials or types.
- For renovation, use Phasing to separate existing, new, and demolished elements.
Add cost calculations and export
- Create Calculated values (Fields → Calculated value), for example Total Cost = quantity field (Area/Volume/Length/Count) × Cost parameter.
- Place the schedule on a sheet for reporting, or export (File → Export → Reports → Schedules) to Excel for further cost analysis.
How to Create a Quantity Takeoff with Frame and Autodesk
At Frame, we believe there is a better way. We have developed a workflow that connects your Autodesk Construction Cloud (ACC) models (or local files) directly to Power BI, allowing you to create dynamic quantity takeoffs in minutes.
We are excited to introduce our Quantities Template for Power BI.
This template transforms the estimation process by delivering:
- Speed: Generate QTOs in minutes, not days.
- Simplicity: No Revit skills required for estimators—just use Power BI.
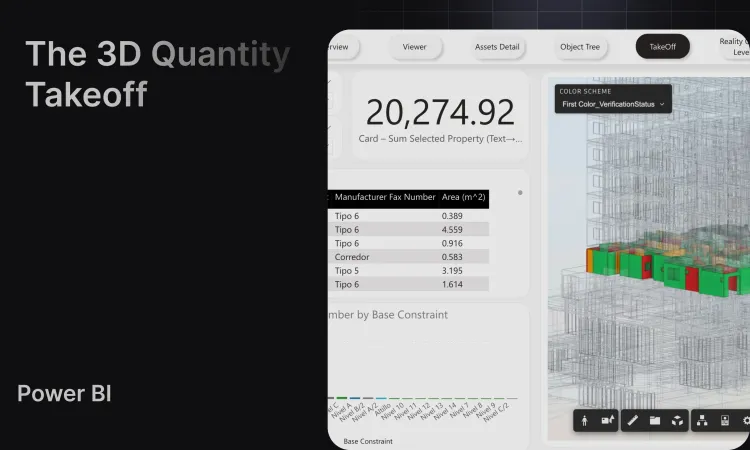
- Visualization: Instantly verify quantities with a connected 3D viewer.
- Sharing: Publish to Power BI Service, embed, or share links so stakeholders see live, color coded quantities without authoring tools.
Watch the full workflow: The clip below shows the complete path connecting an ACC or local model, picking properties and measures, generating the .pbix, and opening the Takeoff tab in Power BI with color coding ready to go.
The Workflow: From ACC (or Local File) to Power BI
- Connect your Model: Upload your model to Frame or connect directly from ACC. Models stay synced, so revisions do not require re exporting schedules.
- Use the Quantities Template: Once your model is processed, generate the Power BI report with our Quantities Template pre modeled relationships and visuals included.
- Customize Your Data: Select the properties and categories you need (for example, category, family/type, material, level, phase). You decide the measures to include (Area, Volume, Count, Length).
- Color Code: Pick a property to drive colors (material, phase, discipline, level). The color mapping comes through in the dataset and into the 3D viewer inside Power BI.
- Export + Share: Download the
.pbixand open it in Power BI Desktop to finalize visuals, then publish to your team or embed.
1. Add Unpivoted Values
From the “Take Off unpivot” table in the data pane, drag the values you selected during the download process (e.g., Area, Volume, Count). These appear individually on the right-hand side in Power BI. Drag them into the table visual to display the results.
2. Configure the Bar Chart
To visualize your data effectively:
- Place the value you chose to color the report by on both the X and Y axes of the bar chart.
- Then, in the visual settings, go to the “Columns” section.
- Click the “fx” (Color) icon.
- Change the “Format style” to “Field value”.
- Select the “Color Code” value from the “Take Off unpivot” table and confirm.
3. Enable Colors in the Viewer
To link the visual colors to the 3D model:
- Click the Frame 3D Visual.
- Drag the “Color Code” column from the data pane into the visual’s data fields.
- You will now be able to enable colors in the 3D viewer, syncing your charts with the model visualization.
(Optional) Suggested visuals to add
- A matrix by Category → Family → Type with Area and Volume.
- A donut or bar by Level to validate vertical stacking quantities.
- A slicer for Phase/Workset to isolate construction packages.
- A bookmark that toggles color coding between Material and Phase for quick reviews.
Quality checks before you publish
- Spot check totals against a known BOQ line item.
- Filter by a single level and compare against Revit schedule numbers.
- Verify that selecting a row in the table isolates the same element in the 3D viewer (ensures
externalIdmapping is intact).
Benefits of this Approach
Why switch to this workflow?
We have invested heavily in these templates so construction teams, even with small BI capability, can skip data wrangling and focus on insights, validation, and decision making.
- Quantities Reports in Minutes: immense time savings compared to manual extraction.
- Easy to Adopt: Everyone knows how to use Power BI; no need to teach estimators how to use Revit.
- Clean Datasets: Frame structures the BIM data automatically, giving you analysis ready tables.
- Custom Viewer: Our custom Power BI viewer lets you isolate, filter, and color code elements instantly.
- Beautiful Visualizations: Turn dry tables into compelling, interactive dashboards that stakeholders can understand at a glance.
- Always up to date: Refresh from ACC or upload a new local version without recreating schedules or exports.
- Traceable:
externalIdkeeps every quantity tied to the exact model element for auditability.
When to use this workflow (and who benefits)
- Estimators: Rapid precon takeoffs without opening Revit.
- Project managers: Validate scope by phase or work package with a slicer.
- Owners/clients: Share a linkable dashboard instead of static PDFs.
- BIM managers: Maintain one data pipeline instead of per trade exports.
Next Steps
Now that you have mastered Quantity Takeoffs, how do you integrate other BIM dimensions? Check out our guides on:
Ready to streamline your estimation process? Start with Frame today.