Large Revit Models in Power BI: Viewer and Dataset Architecture That Scales
How Frame prepares large Revit models and Autodesk Forma data for Power BI with server-side model processing, compressed Parquet artifacts, reusable Assets and Properties queries, stable viewer IDs, and batched 3D operations.

Frame Team

One realization from working on Power BI reports with real Revit models: a big model is not a small demo model with more rows.
The object tree is deeper. Property names are less consistent. A report may need millions of property values to explain a much smaller set of visible assets. The viewer has its own geometry, memory, and selection costs. A federated Forma view adds several child models and several identity spaces to the same page.
We have been architecting Frame around that case. The work starts before Power BI opens and continues inside the custom viewer.
Frame works with local Revit, IFC, and Navisworks files as well as Autodesk Forma project sources. Autodesk Construction Cloud (ACC) became Autodesk Forma in March 2026, so this post uses Forma for the current product name and keeps ACC where it helps people connect the workflow to older documentation. Autodesk describes the change in its Forma rebrand announcement.
This post explains the current shape of that pipeline and the tradeoffs behind it. It is an architecture note, not a universal benchmark. The model that matters is still the largest, least tidy project your team needs to review.
The Pipeline In One View
The report path moves from model ingestion through server-side processing to prepared Parquet datasets, then into Power BI and the connected viewer.
The architectural decision is simple: Power BI should analyze prepared model data. It should not become the model-processing engine every time a template opens.
1. Preserve The Model Source And Version
Frame accepts local files and Autodesk Forma sources. In older documentation, the same construction-cloud source may still be called Autodesk Construction Cloud or ACC.
For local Revit, IFC, and Navisworks files, Frame uploads the source to Autodesk Platform Services and prepares its derivatives. For Forma sources, Frame keeps the project, folder, item, version, region, and derivative identities separate. A document item can publish many versions, and a federated model-coordination view can reference several child models.
This identity work is easy to overlook. It is what lets the report answer a basic question later: which model version produced these rows and this viewer state?
When a new Forma version arrives, Frame can generate a new set of artifacts and keep version-comparison data outside the Power BI template. The report receives ready comparison tables instead of computing a full model diff in Power Query.
2. Normalize The Object Tree By File Type
APS gives us geometry, an object tree, and properties. Those sources do not all describe model hierarchy in the same way.
Frame’s report pipeline treats each file family deliberately:
- Revit: category, family, and symbol/type hierarchy
- IFC: IFC type, building storey, GlobalId, tag, and Revit-export context when available
- Navisworks: source file, object type, and the hierarchy inherited from the coordination model
The Assets table is created by walking the object tree and attaching that hierarchy to the objects that also have reportable properties. The Properties table turns nested property groups into a tabular shape:
objectId | section | name | value | dataTypeContextdataTypeContext keeps detected units separate from the value where possible.
That gives Power BI a cleaner starting point for numeric measures while
preserving the original property context.
This normalization is intentionally boring. It is also where a large part of report reliability comes from.
3. How The Stack Handles The Work
There is no single large-model switch. At the level we can share, Frame uses a small set of separate runtime responsibilities:
- Autodesk’s model services handle source-model access and derivative preparation.
- A durable workflow layer orchestrates the long-running report stages, retries, and federated package work instead of making one request hold the whole job.
- Isolated report-engine workers extract, normalize, and write the report artifacts outside the interactive report request.
- Compressed, columnar artifacts give Power BI a prepared dataset, while the custom viewer handles geometry and bounded interactive operations separately.
The workflow records progress between stages, validates the worker output, and persists artifact pointers before the report consumes them. For federated projects, the same pattern can process child packages in chunks and assemble an aggregate view without forcing one interactive request to carry the entire project.
That separation is the practical part of the stack. A Power BI session does not have to translate a model, walk its entire property tree, flatten every nested response, and initialize the viewer at the same moment. The report opens against prepared data, while the viewer requests the model objects it needs for the current interaction.
This is intentionally a high-level description. The implementation details, capacity thresholds, and infrastructure choices are part of Frame’s internal engineering work. The useful takeaway is the boundary between preparation, analytics data, and interactive geometry.
4. What We Observed With Autodesk Data Exchange
We have run similar large-model scenarios through Autodesk’s native Data Exchange and Data Connector for Power BI workflow. In the larger cases we tested, some Data Exchange jobs did not complete. In other cases, the exchange completed but the resulting data was not able to load successfully into Power BI.
That is an observation from the scenarios we ran, not a universal benchmark or a claim that every Data Exchange workflow fails. Model composition, selected properties, exchange configuration, and Power BI resource limits all affect the result. The failure mode is still important: if the exchange cannot complete or the output cannot load, the team cannot reach the dashboard-building step.
This experience shaped the Frame architecture. The model-processing work needs to happen before the interactive report session, and the output needs to be organized for model-centered analysis rather than placed into one oversized table. Our earlier comparison covers the broader choices between Data Exchange, custom Autodesk platform workflows, and Frame: Autodesk Data Exchange for Power BI vs Frame.
5. Materialize Report Artifacts Before Power BI
Once the rows are prepared, Frame writes report datasets as compressed Parquet artifacts. A normal model package includes:
assets.parquetproperties.parquetviews.parquetissues.parquetwhen the workflow includes Forma issues
Federated packages can include aggregate artifacts and view-specific artifacts. Version workflows can add element-change and property-change Parquet files.
Parquet is useful here because it is columnar and compressed. A Power BI query that needs category, family, symbol, and object ID should not have to parse every property value or download a raw nested model response first.
Frame also builds small index artifacts for common Assets columns and property lookups used by analytics workflows. The heavy conversion remains a server-side job. The generated URLs are attached to the model version so downstream tools use the same report package.
6. Give Report Authors Stable Base Queries
The Power BI template exposes the report package through clear base queries. The two that matter most are:
FRAME_AssetsFRAME_Properties
An author can reference or duplicate those queries to create a report-specific table:
- mechanical equipment by system
- doors missing fire-rating data
- rooms by department and level
- assets grouped by source model
- model-health checks by parameter
- quantity rows joined to cost or schedule data
The base queries remain recognizable while the report-specific tables carry the business logic. That separation is useful on large models because it reduces the temptation to repeat the raw model transformation in several Power Query branches.
It also makes the dataset easier to explain. A BIM coordinator can open the Data pane and understand where objects end and property values begin.
7. Keep Viewer IDs Aligned With Report Rows
The 3D visual and the semantic model have to agree on object identity.
Each asset row retains the identifiers required to find the corresponding APS viewer object. In a federated view, Frame also keeps enough source-model context to avoid treating identical numeric database IDs from different child models as the same object.
That mapping supports both directions:
- A Power BI filter resolves report rows to viewer objects, then isolates, highlights, zooms, or colors them.
- A viewer selection resolves model objects to report identity, then sends the selection back to the surrounding visuals.
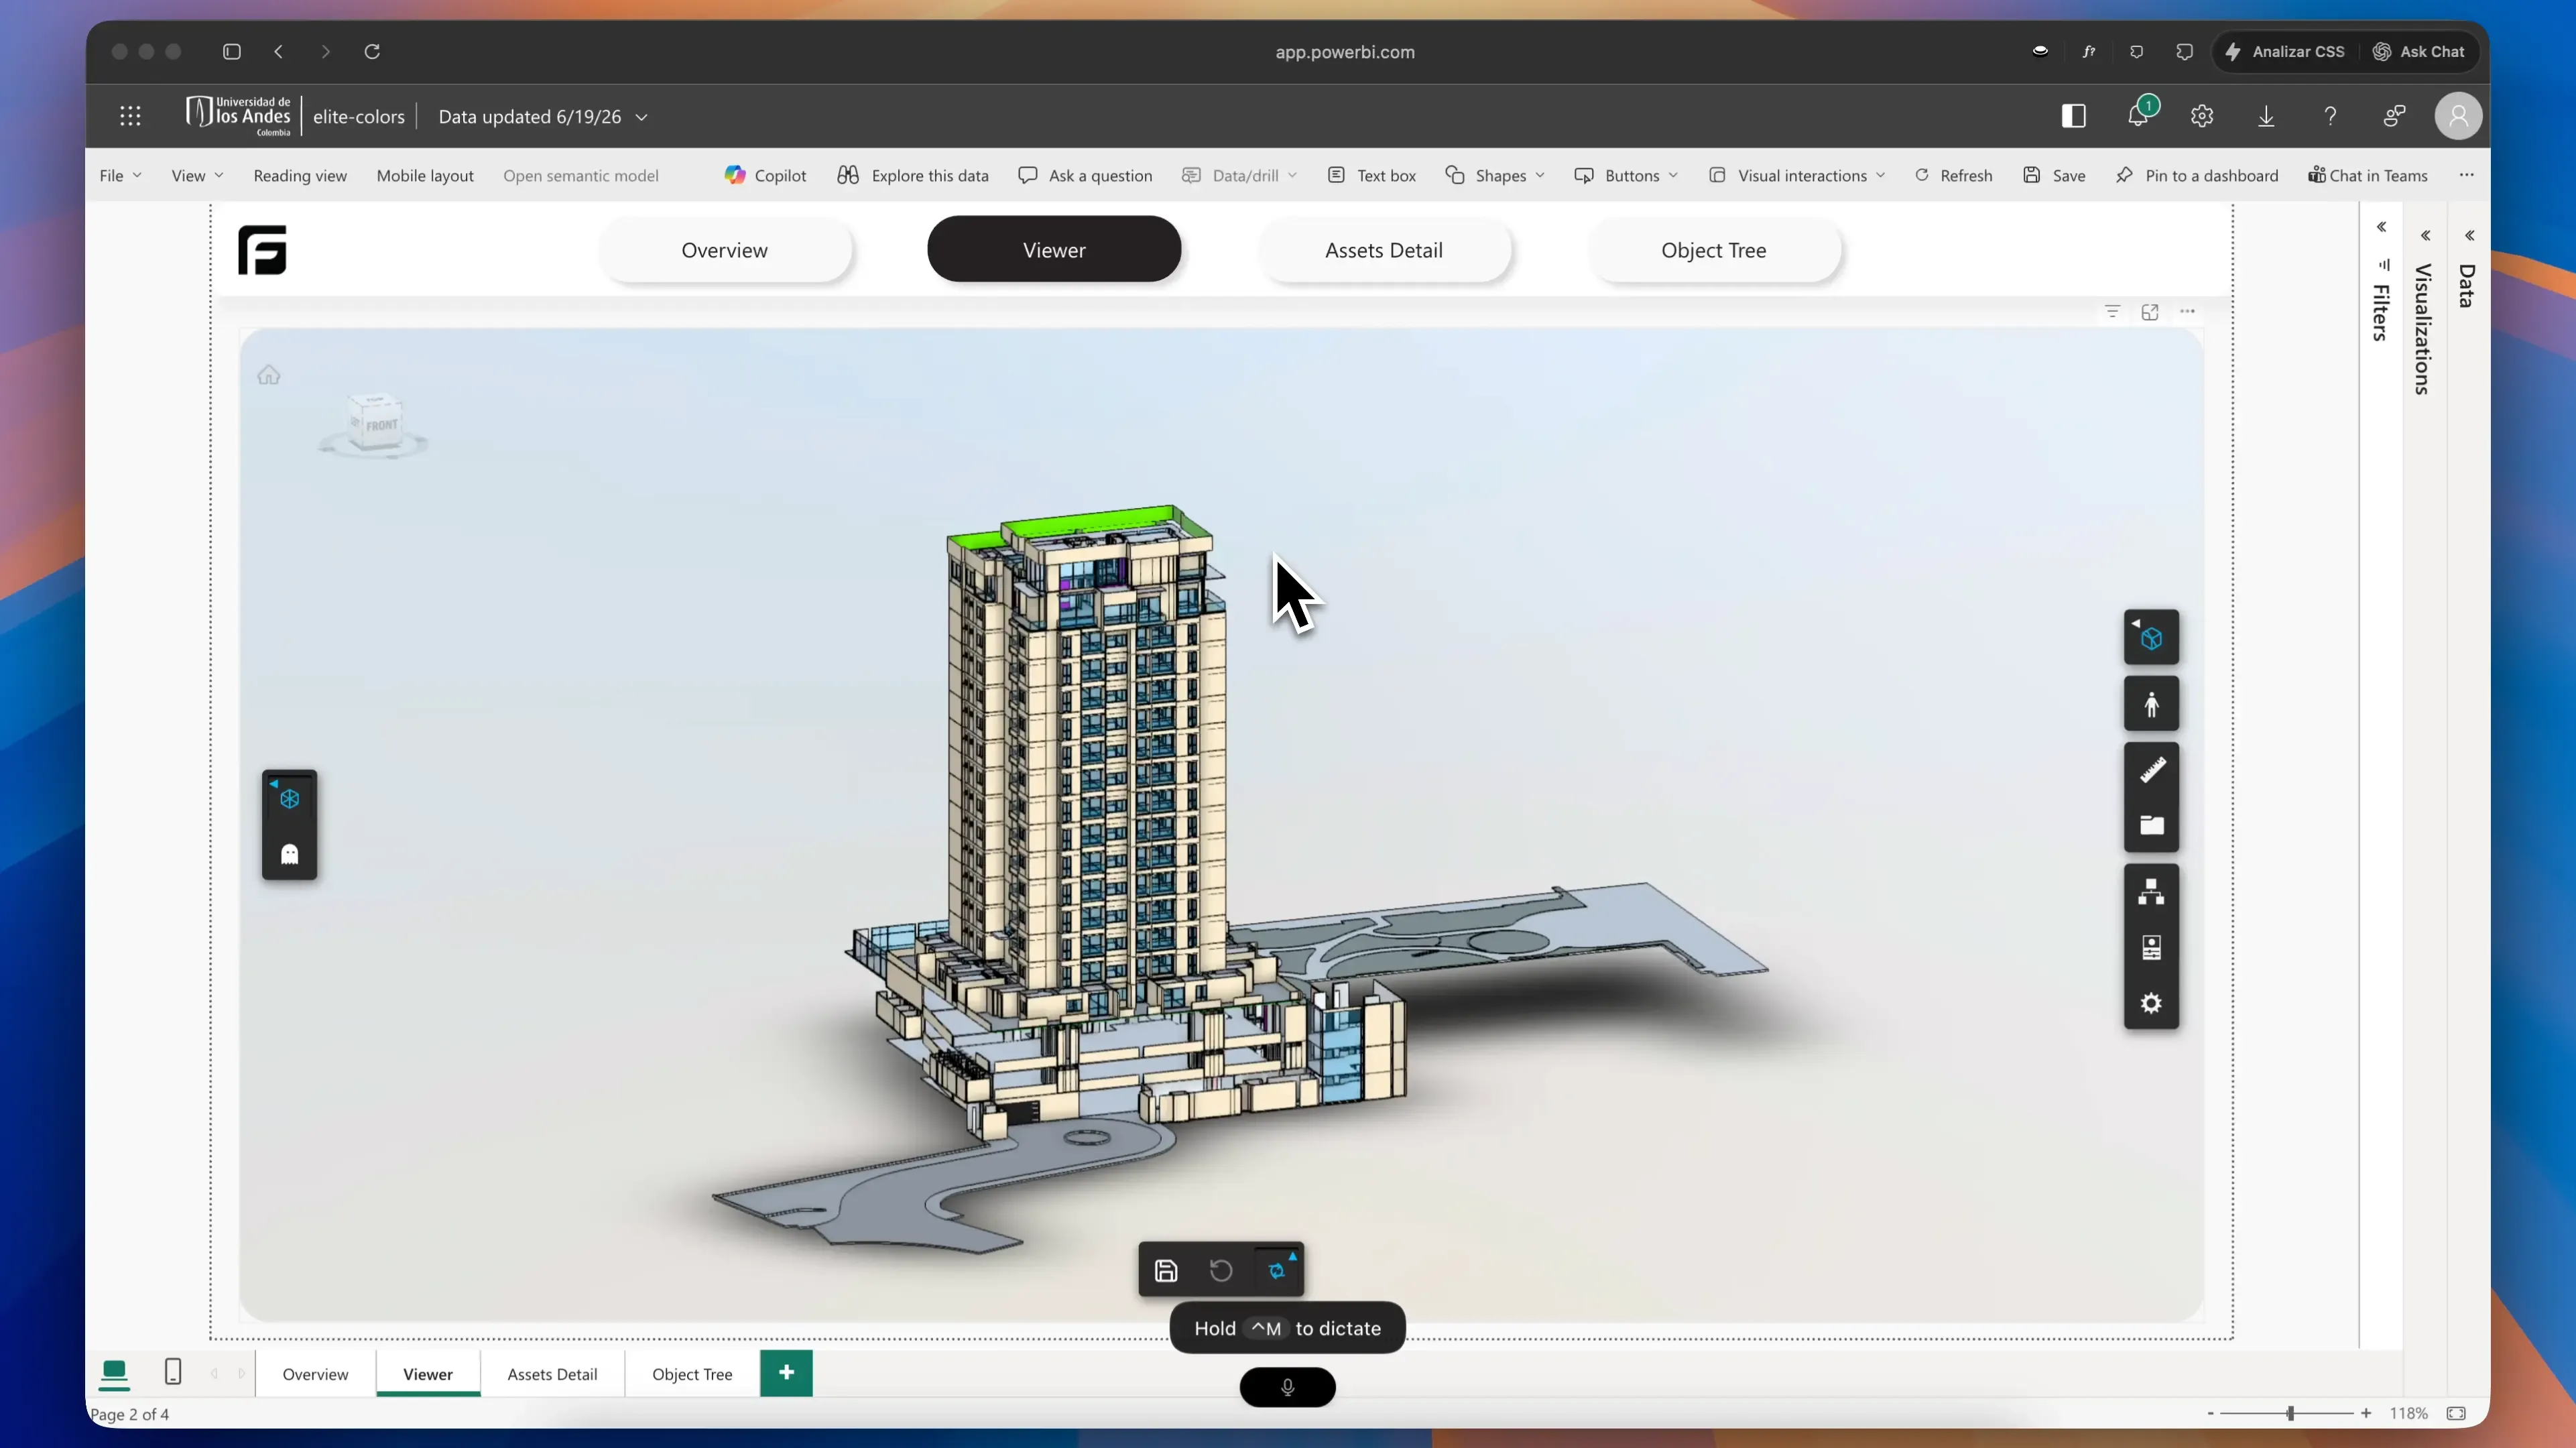
Without stable identity, the model is only a picture beside the report. With stable identity, the viewer can validate the number someone is discussing.
8. Batch Expensive Viewer Operations
The browser has limits even when the report data is prepared well.
Viewer extensions often need bulk properties for many database IDs. Color coding may need to group thousands of objects by property value or source model. A single unbounded request can consume too much memory or make the visual unresponsive.
Frame’s viewer extensions process bulk property reads in sequential batches. The color-coding extension follows the same pattern before applying theming colors and isolation. Selection updates are also debounced so a fast sequence of report changes does not force the full interaction path to run for every intermediate state.
Batching does not make the work free. It makes memory and UI behavior more predictable, which is usually the more important property during a review.
9. Treat Saved State As Data
Large-model users repeat prepared views.
A coordination lead may spend several minutes selecting child models, opening a specific view, isolating an element set, applying colors, and positioning the camera. Rebuilding that state every week is wasted work.
Frame lets the workflow preserve:
- camera views
- isolated element sets
- color states
- viewer preferences
- markers and markup context
- federated child-model visibility and view context
Saved state also has to stay small. We store the useful identifiers and settings rather than trying to serialize the entire live viewer. The model can reload from its derivative, then reapply the review state.
10. Federated Models Need An Aggregate And A Child View
A federated Forma model is not one large Revit file. It is a coordination context composed from several models, versions, and views.
Frame prepares aggregate report artifacts for portfolio-level filtering while retaining child-model and view-specific artifacts where the report needs them. The viewer’s federated browser keeps the user aware of which model and view they are inspecting.
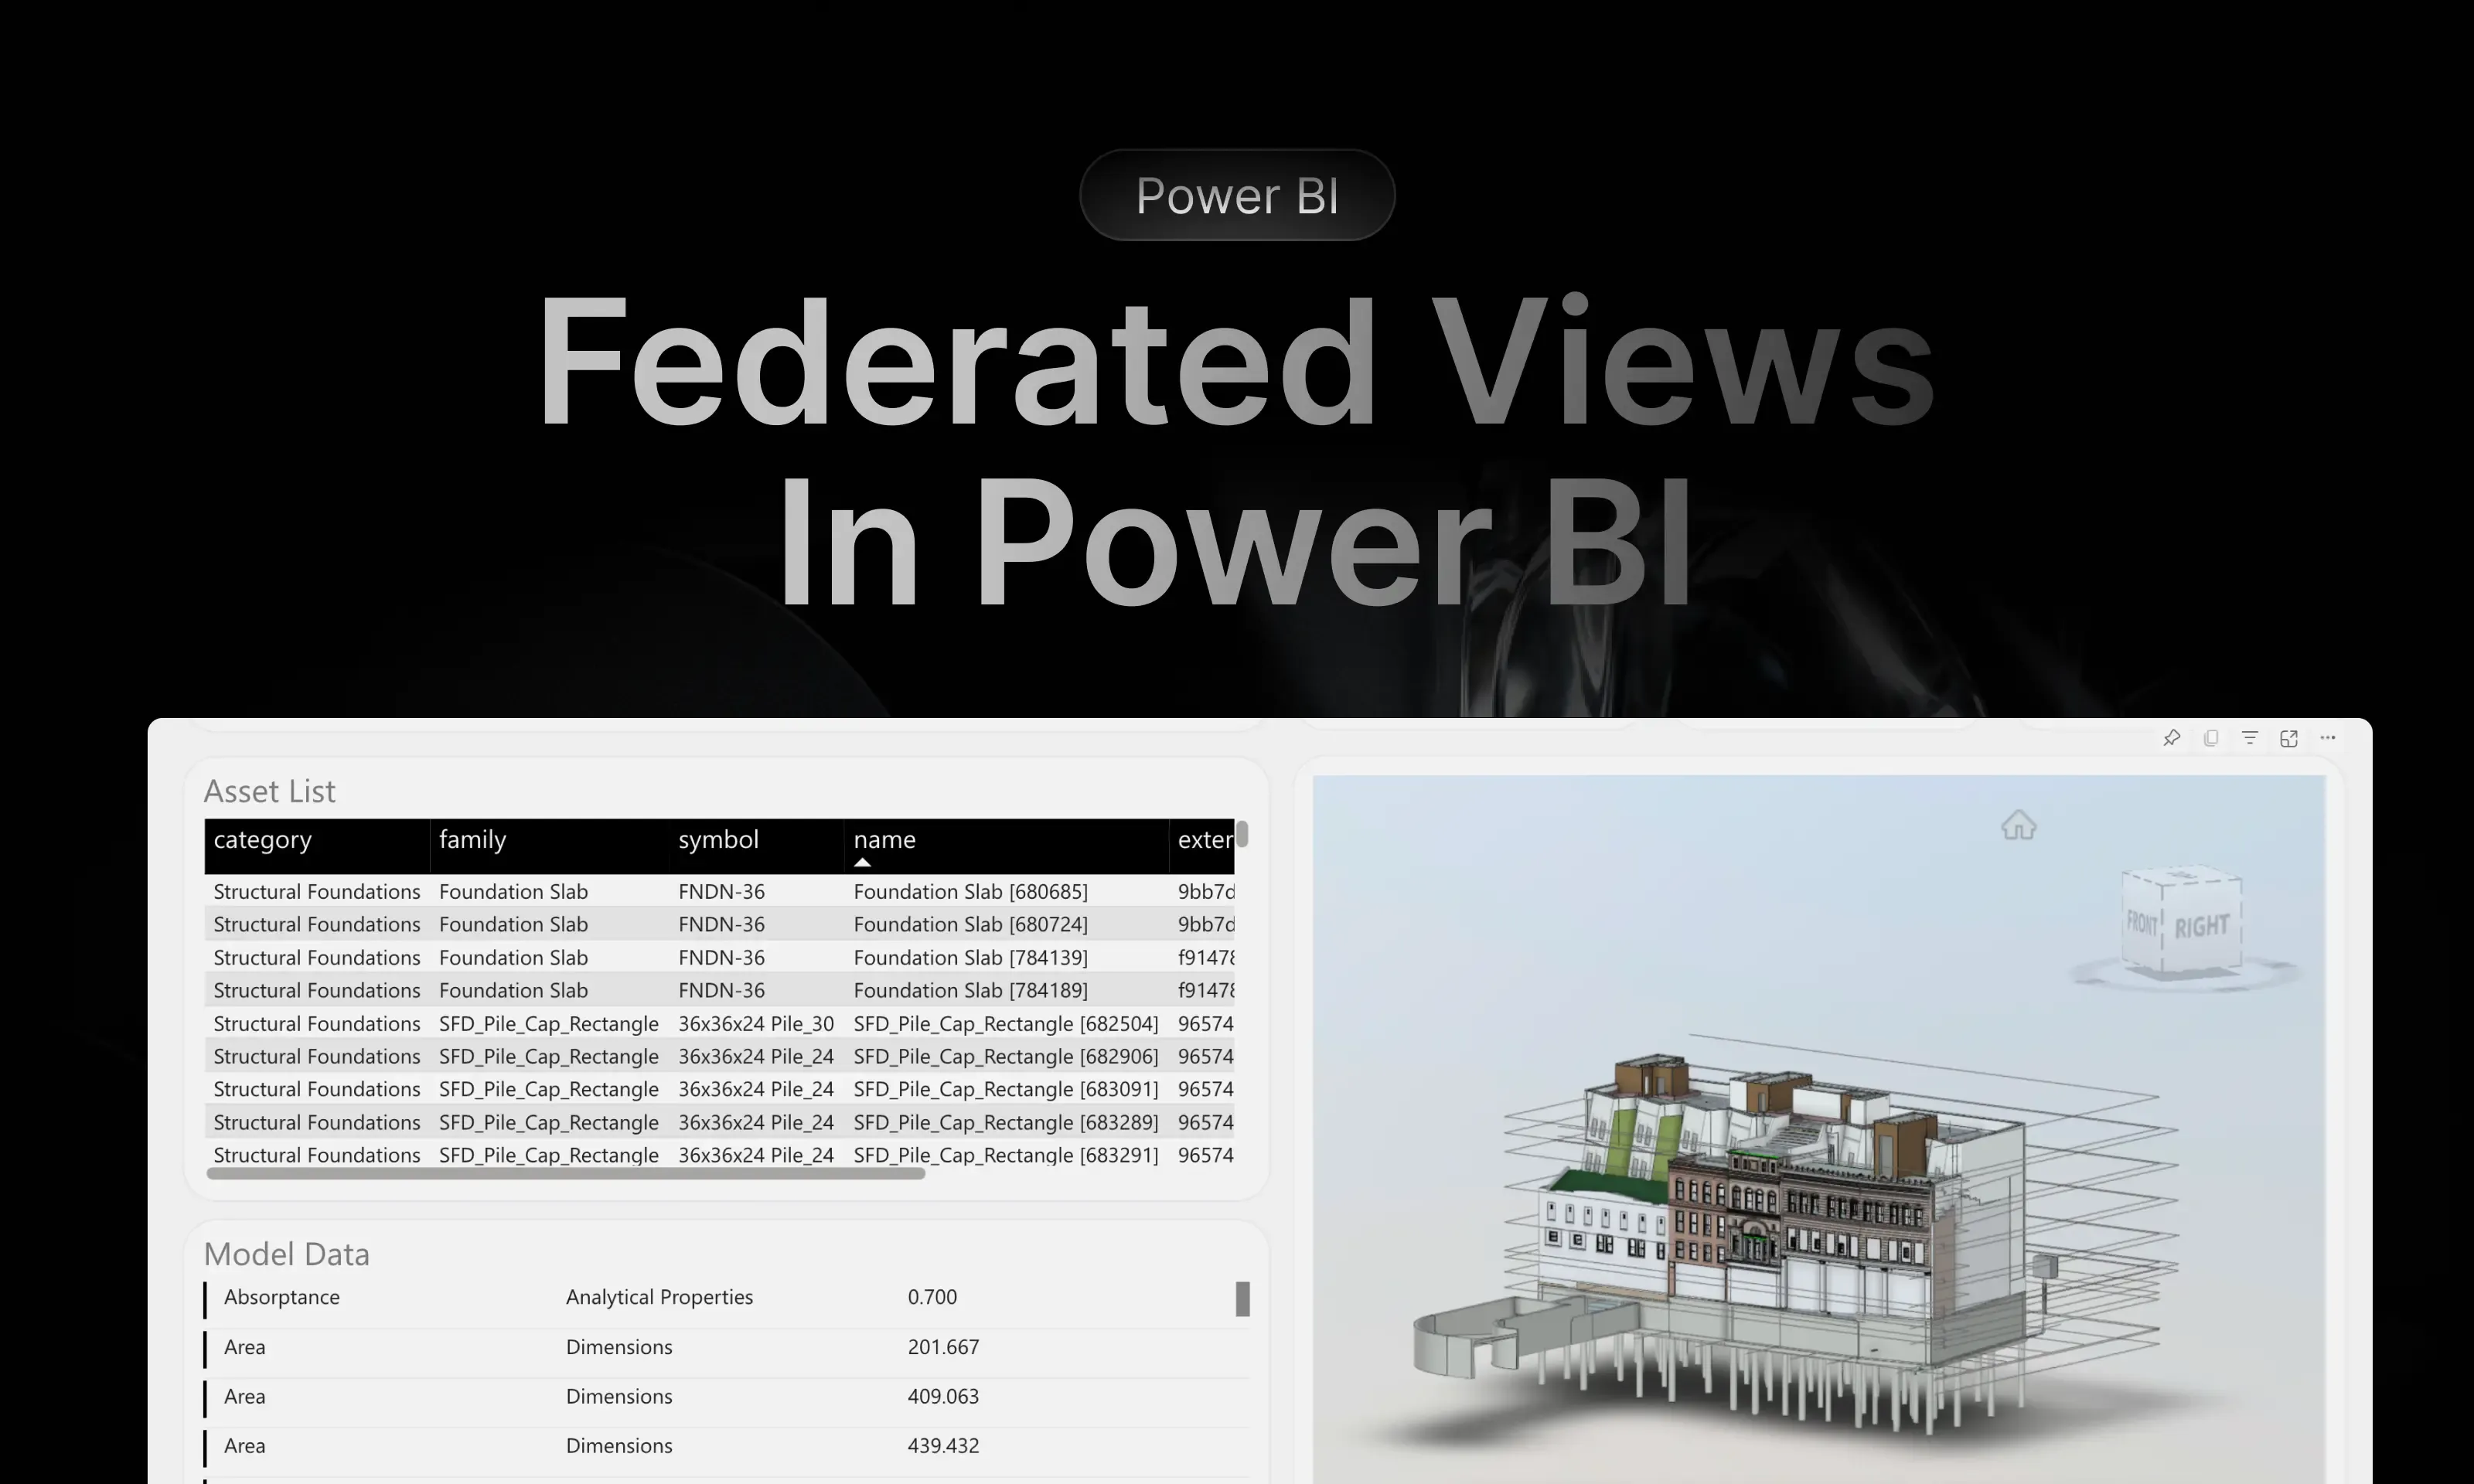
This avoids flattening the project so aggressively that the report loses its source-model context. A structural object and an architectural object can appear in the same analysis while still carrying their model identity.
For the complete workflow, read Federated Forma Models and Views in Frame and Power BI.
What Still Belongs In Power BI
Moving model processing server-side does not mean removing Power BI from the architecture.
Power BI should still own the work it is good at:
- relationships between model data and schedule, cost, asset, or issue data
- DAX measures and project KPIs
- report-level filtering and drill-through
- row-level security and distribution
- pages shaped around the decision a team needs to make
Frame prepares the BIM layer. The report author still decides what the model means for this project.
A Recommended Frame Review Flow
Before sharing a model-connected report, we recommend walking through a small interaction loop. It is useful for a first project review, an updated model, or a federated view. It is not limited to large models.
Use the flow to check that the report starts with the intended model and version, filters highlight the expected objects, viewer selections update the surrounding visuals, and saved views survive a reload. For larger models, also measure generation time, artifact size, Power BI refresh time, first viewer load, selection response, and memory behavior. A single “supports large models” label cannot replace those checks.
Where This Architecture Is Going
We are continuing to move expensive, repeatable work toward durable report generation and to keep the Power BI and viewer surfaces focused on interaction.
The principle has held up well: materialize model facts once, preserve their identity, and reuse the resulting artifacts across reports, versions, viewers, Excel, and analytics workflows.
Large-model performance is still a moving target because the difficult model keeps changing. A federated hospital, a high-rise Revit model, and a Navisworks coordination file stress different parts of the system. The architecture needs to make those differences visible enough to improve rather than hiding them behind one benchmark.
Related reading: